Bank of America 2014 Annual Report Download - page 4
Download and view the complete annual report
Please find page 4 of the 2014 Bank of America annual report below. You can navigate through the pages in the report by either clicking on the pages listed below, or by using the keyword search tool below to find specific information within the annual report.-
 1
1 -
 2
2 -
 3
3 -
 4
4 -
 5
5 -
 6
6 -
 7
7 -
 8
8 -
 9
9 -
 10
10 -
 11
11 -
 12
12 -
 13
13 -
 14
14 -
 15
15 -
16
-
17
-
18
-
19
-
20
-
21
-
22
-
23
-
24
-
25
-
26
-
27
-
28
-
29
-
30
-
31
-
32
-
33
-
34
-
35
-
36
-
37
-
38
-
39
-
40
-
41
-
42
-
43
-
44
-
45
-
46
-
47
-
48
-
49
-
50
-
51
-
52
-
53
-
54
-
55
-
56
-
57
-
58
-
59
-
60
-
61
-
62
-
63
-
64
-
65
-
66
-
67
-
68
-
69
-
70
-
71
-
72
-
73
-
74
-
75
-
76
-
77
-
78
-
79
-
80
-
81
-
82
-
83
-
84
-
85
-
86
-
87
-
88
-
89
-
90
-
91
-
92
-
93
-
94
-
95
-
96
-
97
-
98
-
99
-
100
-
101
-
102
-
103
-
104
-
105
-
106
-
107
-
108
-
109
-
110
-
111
-
112
-
113
-
114
-
115
-
116
-
117
-
118
-
119
-
120
-
121
-
122
-
123
-
124
-
125
-
126
-
127
-
128
-
129
-
130
-
131
-
132
-
133
-
134
-
135
-
136
-
137
-
138
-
139
-
140
-
141
-
142
-
143
-
144
-
145
-
146
-
147
-
148
-
149
-
150
-
151
-
152
-
153
-
154
-
155
-
156
-
157
-
158
-
159
-
160
-
161
-
162
-
163
-
164
-
165
-
166
-
167
-
168
-
169
-
170
-
171
-
172
-
173
-
174
-
175
-
176
-
177
-
178
-
179
-
180
-
181
-
182
-
183
-
184
-
185
-
186
-
187
-
188
-
189
-
190
-
191
-
192
-
193
-
194
-
195
-
196
-
197
-
198
-
199
-
200
-
201
-
202
-
203
-
204
-
205
-
206
-
207
-
208
-
209
-
210
-
211
-
212
-
213
-
214
-
215
-
216
-
217
-
218
-
219
-
220
-
221
-
222
-
223
-
224
-
225
-
226
-
227
-
228
-
229
-
230
-
231
-
232
-
233
-
234
-
235
-
236
-
237
-
238
-
239
-
240
-
241
-
242
-
243
-
244
-
245
-
246
-
247
-
248
-
249
-
250
-
251
-
252
-
253
-
254
-
255
-
256
-
257
-
258
-
259
-
260
-
261
-
262
-
263
-
264
-
265
-
266
-
267
-
268
-
269
-
270
-
271
-
272
 |
 |

2
$152 7.5%
7.2%
6.7%$144
$146
2012
2013
2014
Ratio
$439 39
38
$372
$376
4Q14
4Q13
4Q12 33
Months
their goods to overseas markets. Others are accessing more
markets for their American-made products. Serving these
increasingly global small- and medium-sized companies takes
global capabilities — cash management or, with our sales and
trading capabilities, helping these companies protect against
currency fluctuations and counter-party risk.
Our approach to serving these companies is the same as our
approach to the individuals we serve — connect all of our capabilities
to help them achieve their goals. Being able to do that globally
puts our company at a competitive advantage with these clients.
Our businesses that serve these clients provide great earnings
stability to you as shareholders as we use our balance sheet
to help clients prosper and benefit the economies in which
they operate. Lending and cash management services provide
strong returns. Our Global Markets capabilities also serve
these clients by helping them raise capital efficiently and
effectively, in the U.S. and around the world. As I’ll discuss,
we have sized our capital markets capabilities to serve clients,
not to take outsized proprietary trading positions. Those
capabilities provide direct benefit to companies of all sizes,
helping them access markets and grow. This is an efficient
method of contributing to global economic growth.
We also continue to invest and help business clients by
offering the best means of managing their capital and making
it easier for them to transact with their own customers. With
our CashPro® Online payment application, we have created a
better, more efficient experience for our clients and lowered
our own costs by retiring aging payment technology. This is
just one example of the focus we have to be simpler and to
drive operational excellence. The results of these investments
are seen in many ways, including recognition by Global Finance
magazine as “Best Bank for Cash Management” in North
America for the fih consecutive year.
Our integrated approach makes it more convenient for business
clients to do more with us. In the work we do for our larger
Global Corporate and Investment Banking clients, our teams
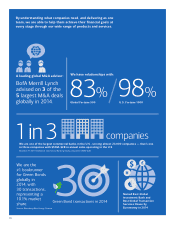
advised on three of the top five global mergers in 2014. Other
indications of greater activity with these clients are seen in
higher average loan balances, which increased $13 billion last
year to $270 billion, and higher average deposit balances,
which grew $25 billion last year to $261 billion.
Also, we are doing more for our business clients through
our Merrill Lynch and U.S. Trust teammates working with
our commercial bankers. For example, the number of funded
institutional retirement plans purchased by companies we
serve grew by 53 percent last year, generating assets of nearly
$9 billion. In addition, we have had thousands of commercial
and corporate clients bring their private assets into our
Global Wealth and Investment Management businesses.
Our teams serving business clients are collaborating across
our franchise to deliver all of our industry-leading products
and services. As I said above, this work is just beginning.
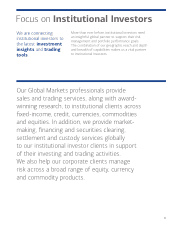
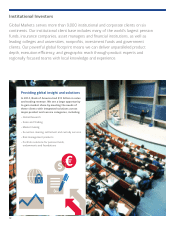
Balanced Global Markets capabilities serving
institutional investors
Alongside the progress we are making in serving individuals
and companies, our third group of clients — institutional
investors — continues to benefit from the investment we
are making in our sales and trading team and in our research
platform of 700 analysts. For the fourth consecutive year,
Bank of America Merrill Lynch was ranked the No. 1 research
firm in the world by Institutional Investor magazine.
We have reduced risk in Global Markets sales and trading
operations over the past several years. At the time of the
Bank of America merger with Merrill Lynch, the markets
business had assets of nearly $1 trillion; and at the end of
the year we were below $600 billion. All measures of risk in
the business were low in 2014 and down significantly from a
few years ago. Our mix of activities has changed, too. Most
importantly, our focus is on enabling our investor clients to
provide the capital and liquidity to companies and markets
around the world, not taking our own trading positions.
We do this by serving as the intermediary between our “issuer”
clients (companies issuing debt or equity) and our investor
clients (pension and retirement funds, for example) looking for
growth and overall returns. We also see synergy with our wealth
management clients in the research we provide to help them
make investment decisions. These industry-leading platforms —
providing ideas and analysis for investors, executing transactions
in markets around the world, and helping companies raise
capital and grow — drive the real economy in the U.S. and
globally. All the while, the team continues to reduce risk, simplify
the business, and produce higher-quality revenue and profits.
Our goal is simple: We do not need to be the largest in the
business, but we want to be the best for the clients we serve.
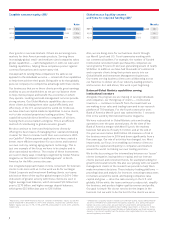
Tangible common equity ($B)1Global excess liquidity sources
and time-to-required funding ($B)2
1 Represents a non-GAAP financial measure. Common shareholders’ equity was $224B,
$221B and $219B at December 31, 2014, 2013 and 2012, respectively. Common share-
holders’ equity ratio was 10.7%, 10.4% and 9.9% at December 31, 2014, 2013 and 2012,
respectively.
2 Global Excess Liquidity Sources include cash and high-quality, liquid, unencumbered
securities, limited to U.S. government and agency securities, U.S. agency mortgage-
backed securities, and a select group of non-U.S. government and supranational
securities, and are readily available to meet funding requirements as they arise. It does
not include Federal Reserve Discount Window or Federal Home Loan Bank borrowing
capacity. Transfers of liquidity from the bank or other regulated entities are subject to
certain regulatory restrictions.