Bank of America 2014 Annual Report Download - page 61
Download and view the complete annual report
Please find page 61 of the 2014 Bank of America annual report below. You can navigate through the pages in the report by either clicking on the pages listed below, or by using the keyword search tool below to find specific information within the annual report.-
 1
1 -
2
-
3
-
4
-
5
-
6
-
7
-
8
-
9
-
10
-
11
-
12
-
13
-
14
-
15
-
16
-
17
-
18
-
19
-
20
-
21
-
22
-
23
-
24
-
25
-
26
-
27
-
28
-
29
-
30
-
31
-
32
-
33
-
34
-
35
-
36
-
37
-
38
-
39
-
40
-
41
-
42
-
43
-
44
-
45
-
46
-
47
-
48
-
49
-
50
-
 51
51 -
 52
52 -
 53
53 -
 54
54 -
 55
55 -
 56
56 -
 57
57 -
 58
58 -
 59
59 -
 60
60 -
 61
61 -
 62
62 -
 63
63 -
 64
64 -
 65
65 -
 66
66 -
 67
67 -
 68
68 -
 69
69 -
 70
70 -
 71
71 -
72
-
73
-
74
-
75
-
76
-
77
-
78
-
79
-
80
-
81
-
82
-
83
-
84
-
85
-
86
-
87
-
88
-
89
-
90
-
91
-
92
-
93
-
94
-
95
-
96
-
97
-
98
-
99
-
100
-
101
-
102
-
103
-
104
-
105
-
106
-
107
-
108
-
109
-
110
-
111
-
112
-
113
-
114
-
115
-
116
-
117
-
118
-
119
-
120
-
121
-
122
-
123
-
124
-
125
-
126
-
127
-
128
-
129
-
130
-
131
-
132
-
133
-
134
-
135
-
136
-
137
-
138
-
139
-
140
-
141
-
142
-
143
-
144
-
145
-
146
-
147
-
148
-
149
-
150
-
151
-
152
-
153
-
154
-
155
-
156
-
157
-
158
-
159
-
160
-
161
-
162
-
163
-
164
-
165
-
166
-
167
-
168
-
169
-
170
-
171
-
172
-
173
-
174
-
175
-
176
-
177
-
178
-
179
-
180
-
181
-
182
-
183
-
184
-
185
-
186
-
187
-
188
-
189
-
190
-
191
-
192
-
193
-
194
-
195
-
196
-
197
-
198
-
199
-
200
-
201
-
202
-
203
-
204
-
205
-
206
-
207
-
208
-
209
-
210
-
211
-
212
-
213
-
214
-
215
-
216
-
217
-
218
-
219
-
220
-
221
-
222
-
223
-
224
-
225
-
226
-
227
-
228
-
229
-
230
-
231
-
232
-
233
-
234
-
235
-
236
-
237
-
238
-
239
-
240
-
241
-
242
-
243
-
244
-
245
-
246
-
247
-
248
-
249
-
250
-
251
-
252
-
253
-
254
-
255
-
256
-
257
-
258
-
259
-
260
-
261
-
262
-
263
-
264
-
265
-
266
-
267
-
268
-
269
-
270
-
271
-
272
 |
 |

Bank of America 2014 59
At December 31, 2014, an increase or decrease in our
Common equity tier 1, Tier 1 or Total capital ratios by one bp would
require a change of $126 million in Common equity tier 1, Tier 1
or Total capital. We could also increase our Common equity tier 1,
Tier 1 or Total capital ratios by one bp on such date by a reduction
in risk-weighted assets of $1.0 billion, $941 million and $762
million, respectively. An increase in our Tier 1 leverage ratio by one
bp on such date would require $206 million of additional Tier 1
capital or a reduction of $2.5 billion in adjusted average assets.
Risk-weighted assets decreased $36 billion during 2014 to
$1,262 billion primarily due to decreases in market risk, and
residential mortgage and consumer credit card balances, partially
offset by the impact of certain transition provisions under Basel
3 Standardized – Transition, and an increase in commercial loans.
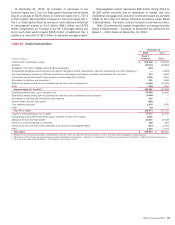
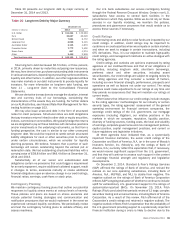
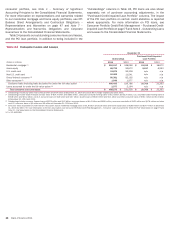
Table 15 presents the capital composition as measured under
Basel 3 Standardized – Transition at December 31, 2014 and the
Basel 1 – 2013 Rules at December 31, 2013.
Table 15 Capital Composition
December 31
2014 2013
(Dollars in millions)
Basel 3
Transition Basel 1
Total common shareholders’ equity $ 224,162 $ 219,333
Goodwill (69,234) (69,844)
Intangibles, other than mortgage servicing rights and goodwill (639)—
Nonqualifying intangible assets (includes core deposit intangibles, affinity relationships, customer relationships and other intangibles) —(4,263)
Net unrealized gains (losses) on AFS debt securities and net losses on derivatives recorded in accumulated OCI, net-of-tax 573 5,538
Unamortized net periodic benefit costs recorded in accumulated OCI, net-of-tax 2,680 2,407
DVA related to liabilities and derivatives (1) 231 2,188
Deferred tax assets arising from net operating loss and tax credit carryforwards (2) (2,226)(15,391)
Other (186)1,554
Common equity tier 1 capital (3) 155,361 141,522
Qualifying preferred stock, net of issuance cost 19,308 10,435
Deferred tax assets arising from net operating loss and tax credit carryforwards under transition (8,905)—
DVA related to liabilities and derivatives under transition 925 —
Defined benefit pension fund assets (599)—
Trust preferred securities 2,893 5,785
Other (10) —
Total Tier 1 capital 168,973 157,742
Long-term debt qualifying as Tier 2 capital 17,953 21,175
Nonqualifying trust preferred securities subject to phase out from Tier 2 capital 3,881 —
Allowance for loan and lease losses 14,419 17,428
Reserve for unfunded lending commitments 528 484
Allowance for loan and lease losses exceeding 1.25 percent of risk-weighted assets (313)(1,637)
Other 3,229 1,375
Total capital $ 208,670 $ 196,567
(1) Represents loss on structured liabilities and derivatives, net-of-tax, that is excluded from Common equity tier 1, Tier 1 and Total capital for regulatory capital purposes.
(2) December 31, 2014 amount represents phase-in portion under Basel 3 Standardized – Transition. The December 31, 2013 amount represents the full Basel 1 deferred tax asset disallowance.
(3) Tier 1 common capital under the Basel 1 – 2013 Rules at December 31, 2013.