Bank of America 2014 Annual Report Download - page 171
Download and view the complete annual report
Please find page 171 of the 2014 Bank of America annual report below. You can navigate through the pages in the report by either clicking on the pages listed below, or by using the keyword search tool below to find specific information within the annual report.-
 1
1 -
2
-
3
-
4
-
5
-
6
-
7
-
8
-
9
-
10
-
11
-
12
-
13
-
14
-
15
-
16
-
17
-
18
-
19
-
20
-
21
-
22
-
23
-
24
-
25
-
26
-
27
-
28
-
29
-
30
-
31
-
32
-
33
-
34
-
35
-
36
-
37
-
38
-
39
-
40
-
41
-
42
-
43
-
44
-
45
-
46
-
47
-
48
-
49
-
50
-
51
-
52
-
53
-
54
-
55
-
56
-
57
-
58
-
59
-
60
-
61
-
62
-
63
-
64
-
65
-
66
-
67
-
68
-
69
-
70
-
71
-
72
-
73
-
74
-
75
-
76
-
77
-
78
-
79
-
80
-
81
-
82
-
83
-
84
-
85
-
86
-
87
-
88
-
89
-
90
-
91
-
92
-
93
-
94
-
95
-
96
-
97
-
98
-
99
-
100
-
101
-
102
-
103
-
104
-
105
-
106
-
107
-
108
-
109
-
110
-
111
-
112
-
113
-
114
-
115
-
116
-
117
-
118
-
119
-
120
-
121
-
122
-
123
-
124
-
125
-
126
-
127
-
128
-
129
-
130
-
131
-
132
-
133
-
134
-
135
-
136
-
137
-
138
-
139
-
140
-
141
-
142
-
143
-
144
-
145
-
146
-
147
-
148
-
149
-
150
-
151
-
152
-
153
-
154
-
155
-
156
-
157
-
158
-
159
-
160
-
 161
161 -
 162
162 -
 163
163 -
 164
164 -
 165
165 -
 166
166 -
 167
167 -
 168
168 -
 169
169 -
 170
170 -
 171
171 -
 172
172 -
 173
173 -
 174
174 -
 175
175 -
 176
176 -
 177
177 -
 178
178 -
 179
179 -
 180
180 -
 181
181 -
182
-
183
-
184
-
185
-
186
-
187
-
188
-
189
-
190
-
191
-
192
-
193
-
194
-
195
-
196
-
197
-
198
-
199
-
200
-
201
-
202
-
203
-
204
-
205
-
206
-
207
-
208
-
209
-
210
-
211
-
212
-
213
-
214
-
215
-
216
-
217
-
218
-
219
-
220
-
221
-
222
-
223
-
224
-
225
-
226
-
227
-
228
-
229
-
230
-
231
-
232
-
233
-
234
-
235
-
236
-
237
-
238
-
239
-
240
-
241
-
242
-
243
-
244
-
245
-
246
-
247
-
248
-
249
-
250
-
251
-
252
-
253
-
254
-
255
-
256
-
257
-
258
-
259
-
260
-
261
-
262
-
263
-
264
-
265
-
266
-
267
-
268
-
269
-
270
-
271
-
272
 |
 |

Bank of America 2014 169
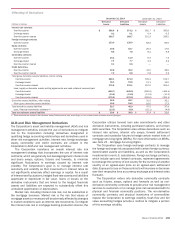
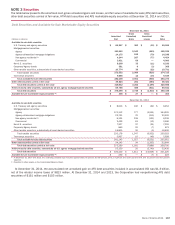
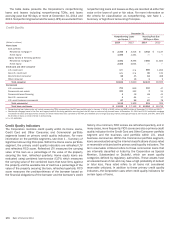
The table below presents the fair value and the associated gross unrealized losses on AFS debt securities and whether these
securities have had gross unrealized losses for less than 12 months or for 12 months or longer at December 31, 2014 and 2013.
Temporarily Impaired and Other-than-temporarily Impaired AFS Debt Securities
December 31, 2014
Less than Twelve Months Twelve Months or Longer Total
(Dollars in millions)
Fair
Value
Gross
Unrealized
Losses
Fair
Value
Gross
Unrealized
Losses
Fair
Value
Gross
Unrealized
Losses
Temporarily impaired available-for-sale debt securities
U.S. Treasury and agency securities $ 10,121 $ (22) $ 667 $(10)$
10,788 $(32)
Mortgage-backed securities:
Agency 1,366 (8) 43,118 (585)44,484 (593)
Agency-collateralized mortgage obligations 2,242 (19) 3,075 (60) 5,317 (79)
Non-agency residential 307 (3) 809 (41) 1,116 (44)
Non-U.S. securities 157 (9) 32 (2)189 (11)
Corporate/Agency bonds 43 (1) 93 (1)136 (2)
Other taxable securities, substantially all asset-backed securities 575 (3) 1,080 (19) 1,655 (22)
Total taxable securities 14,811 (65) 48,874 (718)63,685 (783)
Tax-exempt securities 980 (1) 680 (18) 1,660 (19)
Total temporarily impaired available-for-sale debt securities 15,791 (66) 49,554 (736)65,345 (802)
Other-than-temporarily impaired available-for-sale debt securities (1)
Non-agency residential mortgage-backed securities 555 (33) — — 555 (33)
Total temporarily impaired and other-than-temporarily impaired
available-for-sale debt securities $ 16,346 $ (99) $ 49,554 $ (736)$ 65,900 $ (835)
December 31, 2013
Temporarily impaired available-for-sale debt securities
U.S. Treasury and agency securities $ 5,770 $ (61) $ 19 $ (1) $ 5,789 $ (62)
Mortgage-backed securities:
Agency 132,032 (5,457) 9,324 (497) 141,356 (5,954)
Agency-collateralized mortgage obligations 13,438 (210) 2,661 (105) 16,099 (315)
Non-agency residential 819 (15) 1,237 (106) 2,056 (121)
Commercial 286 (12) — — 286 (12)
Non-U.S. securities — — 45 (24) 45 (24)
Corporate/Agency bonds 106 (3) 282 (4) 388 (7)
Other taxable securities, substantially all asset-backed securities 116 (2) 280 (3) 396 (5)
Total taxable securities 152,567 (5,760) 13,848 (740) 166,415 (6,500)
Tax-exempt securities 1,789 (30) 990 (19) 2,779 (49)
Total temporarily impaired available-for-sale debt securities 154,356 (5,790) 14,838 (759) 169,194 (6,549)
Other-than-temporarily impaired available-for-sale debt securities (1)
Non-agency residential mortgage-backed securities 2 (1) 1 (1) 3 (2)
Total temporarily impaired and other-than-temporarily impaired
available-for-sale debt securities $ 154,358 $ (5,791) $ 14,839 $ (760) $ 169,197 $ (6,551)
(1) Includes other-than-temporarily impaired AFS debt securities on which an OTTI loss, primarily related to changes in interest rates, remains in accumulated OCI.