Bank of America 2014 Annual Report Download - page 225
Download and view the complete annual report
Please find page 225 of the 2014 Bank of America annual report below. You can navigate through the pages in the report by either clicking on the pages listed below, or by using the keyword search tool below to find specific information within the annual report.-
 1
1 -
2
-
3
-
4
-
5
-
6
-
7
-
8
-
9
-
10
-
11
-
12
-
13
-
14
-
15
-
16
-
17
-
18
-
19
-
20
-
21
-
22
-
23
-
24
-
25
-
26
-
27
-
28
-
29
-
30
-
31
-
32
-
33
-
34
-
35
-
36
-
37
-
38
-
39
-
40
-
41
-
42
-
43
-
44
-
45
-
46
-
47
-
48
-
49
-
50
-
51
-
52
-
53
-
54
-
55
-
56
-
57
-
58
-
59
-
60
-
61
-
62
-
63
-
64
-
65
-
66
-
67
-
68
-
69
-
70
-
71
-
72
-
73
-
74
-
75
-
76
-
77
-
78
-
79
-
80
-
81
-
82
-
83
-
84
-
85
-
86
-
87
-
88
-
89
-
90
-
91
-
92
-
93
-
94
-
95
-
96
-
97
-
98
-
99
-
100
-
101
-
102
-
103
-
104
-
105
-
106
-
107
-
108
-
109
-
110
-
111
-
112
-
113
-
114
-
115
-
116
-
117
-
118
-
119
-
120
-
121
-
122
-
123
-
124
-
125
-
126
-
127
-
128
-
129
-
130
-
131
-
132
-
133
-
134
-
135
-
136
-
137
-
138
-
139
-
140
-
141
-
142
-
143
-
144
-
145
-
146
-
147
-
148
-
149
-
150
-
151
-
152
-
153
-
154
-
155
-
156
-
157
-
158
-
159
-
160
-
161
-
162
-
163
-
164
-
165
-
166
-
167
-
168
-
169
-
170
-
171
-
172
-
173
-
174
-
175
-
176
-
177
-
178
-
179
-
180
-
181
-
182
-
183
-
184
-
185
-
186
-
187
-
188
-
189
-
190
-
191
-
192
-
193
-
194
-
195
-
196
-
197
-
198
-
199
-
200
-
201
-
202
-
203
-
204
-
205
-
206
-
207
-
208
-
209
-
210
-
211
-
212
-
213
-
214
-
 215
215 -
 216
216 -
 217
217 -
 218
218 -
 219
219 -
 220
220 -
 221
221 -
 222
222 -
 223
223 -
 224
224 -
 225
225 -
 226
226 -
 227
227 -
 228
228 -
 229
229 -
 230
230 -
 231
231 -
 232
232 -
 233
233 -
 234
234 -
 235
235 -
236
-
237
-
238
-
239
-
240
-
241
-
242
-
243
-
244
-
245
-
246
-
247
-
248
-
249
-
250
-
251
-
252
-
253
-
254
-
255
-
256
-
257
-
258
-
259
-
260
-
261
-
262
-
263
-
264
-
265
-
266
-
267
-
268
-
269
-
270
-
271
-
272
 |
 |

Bank of America 2014 223
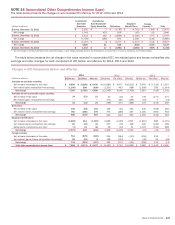
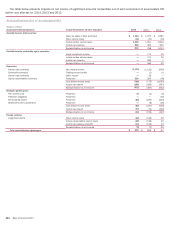
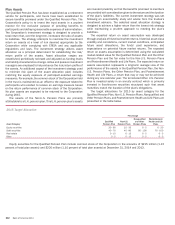
NOTE 14 Accumulated Other Comprehensive Income (Loss)
The table below presents the changes in accumulated OCI after-tax for 2012, 2013 and 2014.
(Dollars in millions)
Available-for-
Sale Debt
Securities
Available-for-
Sale Marketable
Equity Securities Derivatives
Employee
Benefit Plans
Foreign
Currency (1) Total
Balance, December 31, 2011 $ 3,100 $ 3 $ (3,785) $ (4,391) $ (364) $ (5,437)
Net change 1,343 459 916 (65) (13) 2,640
Balance, December 31, 2012 $ 4,443 $ 462 $ (2,869) $ (4,456) $ (377) $ (2,797)
Net change (7,700) (466) 592 2,049 (135) (5,660)
Balance, December 31, 2013 $ (3,257) $ (4) $ (2,277) $ (2,407) $ (512) $ (8,457)
Net change 4,600 21 616 (943) (157) 4,137
Balance, December 31, 2014 $ 1,343 $ 17 $ (1,661)$ (3,350)$ (669) $ (4,320)
(1) The net change in fair value represents the impact of changes in spot foreign exchange rates on the Corporation’s net investment in non-U.S. operations, and related hedges.
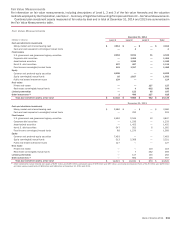
The table below presents the net change in fair value recorded in accumulated OCI, net realized gains and losses reclassified into
earnings and other changes for each component of OCI before- and after-tax for 2014, 2013 and 2012.
Changes in OCI Components Before- and After-tax
2014 2013 2012
(Dollars in millions) Before-tax Tax effect After-tax Before-tax Tax effect After-tax Before-tax Tax effect After-tax
Available-for-sale debt securities:
Net increase (decrease) in fair value $ 8,698 $ (3,268) $ 5,430 $ (10,989) $ 4,077 $ (6,912) $ 3,676 $ (1,319) $ 2,357
Net realized gains reclassified into earnings (1,338) 508 (830) (1,251) 463 (788) (1,609) 595 (1,014)
Net change 7,360 (2,760) 4,600 (12,240) 4,540 (7,700) 2,067 (724) 1,343
Available-for-sale marketable equity securities:
Net increase in fair value 34 (13) 21 32 (12) 20 748 (277) 471
Net realized gains reclassified into earnings ———
(771) 285 (486) (19) 7 (12)
Net change 34 (13) 21 (739) 273 (466) 729 (270) 459
Derivatives:
Net increase in fair value 195 (54) 141 156 (51) 105 430 (166) 264
Net realized losses reclassified into earnings 760 (285) 475 773 (286) 487 1,035 (383) 652
Net change 955 (339) 616 929 (337) 592 1,465 (549) 916
Employee benefit plans:
Net increase (decrease) in fair value (1,629) 614 (1,015)2,985 (1,128) 1,857 (1,891) 660 (1,231)
Net realized losses reclassified into earnings 55 (23) 32 237 (79) 158 490 (192) 298
Settlements, curtailments and other (1) 41 40 46 (12) 34 1,378 (510) 868
Net change (1,575) 632 (943) 3,268 (1,219) 2,049 (23) (42) (65)
Foreign currency:
Net increase (decrease) in fair value 714 (879) (165) 244 (384) (140) (226) 233 7
Net realized (gains) losses reclassified into earnings 20 (12) 8 138 (133) 5 (30) 10 (20)
Net change 734 (891) (157) 382 (517) (135) (256) 243 (13)
Total other comprehensive income (loss) $ 7,508 $ (3,371) $ 4,137 $ (8,400) $ 2,740 $ (5,660) $ 3,982 $ (1,342) $ 2,640