Bank of America 2014 Annual Report Download - page 34
Download and view the complete annual report
Please find page 34 of the 2014 Bank of America annual report below. You can navigate through the pages in the report by either clicking on the pages listed below, or by using the keyword search tool below to find specific information within the annual report.-
 1
1 -
2
-
3
-
4
-
5
-
6
-
7
-
8
-
9
-
10
-
11
-
12
-
13
-
14
-
15
-
16
-
17
-
18
-
19
-
20
-
21
-
22
-
23
-
 24
24 -
 25
25 -
 26
26 -
 27
27 -
 28
28 -
 29
29 -
 30
30 -
 31
31 -
 32
32 -
 33
33 -
 34
34 -
 35
35 -
 36
36 -
 37
37 -
 38
38 -
 39
39 -
 40
40 -
 41
41 -
 42
42 -
 43
43 -
 44
44 -
45
-
46
-
47
-
48
-
49
-
50
-
51
-
52
-
53
-
54
-
55
-
56
-
57
-
58
-
59
-
60
-
61
-
62
-
63
-
64
-
65
-
66
-
67
-
68
-
69
-
70
-
71
-
72
-
73
-
74
-
75
-
76
-
77
-
78
-
79
-
80
-
81
-
82
-
83
-
84
-
85
-
86
-
87
-
88
-
89
-
90
-
91
-
92
-
93
-
94
-
95
-
96
-
97
-
98
-
99
-
100
-
101
-
102
-
103
-
104
-
105
-
106
-
107
-
108
-
109
-
110
-
111
-
112
-
113
-
114
-
115
-
116
-
117
-
118
-
119
-
120
-
121
-
122
-
123
-
124
-
125
-
126
-
127
-
128
-
129
-
130
-
131
-
132
-
133
-
134
-
135
-
136
-
137
-
138
-
139
-
140
-
141
-
142
-
143
-
144
-
145
-
146
-
147
-
148
-
149
-
150
-
151
-
152
-
153
-
154
-
155
-
156
-
157
-
158
-
159
-
160
-
161
-
162
-
163
-
164
-
165
-
166
-
167
-
168
-
169
-
170
-
171
-
172
-
173
-
174
-
175
-
176
-
177
-
178
-
179
-
180
-
181
-
182
-
183
-
184
-
185
-
186
-
187
-
188
-
189
-
190
-
191
-
192
-
193
-
194
-
195
-
196
-
197
-
198
-
199
-
200
-
201
-
202
-
203
-
204
-
205
-
206
-
207
-
208
-
209
-
210
-
211
-
212
-
213
-
214
-
215
-
216
-
217
-
218
-
219
-
220
-
221
-
222
-
223
-
224
-
225
-
226
-
227
-
228
-
229
-
230
-
231
-
232
-
233
-
234
-
235
-
236
-
237
-
238
-
239
-
240
-
241
-
242
-
243
-
244
-
245
-
246
-
247
-
248
-
249
-
250
-
251
-
252
-
253
-
254
-
255
-
256
-
257
-
258
-
259
-
260
-
261
-
262
-
263
-
264
-
265
-
266
-
267
-
268
-
269
-
270
-
271
-
272
 |
 |

32 Bank of America 2014
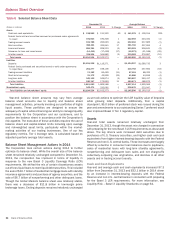
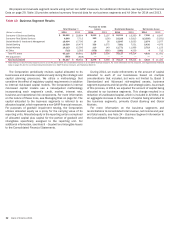
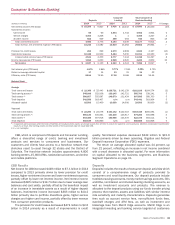
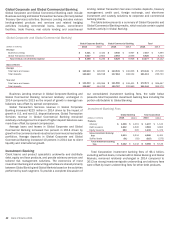
We prepare and evaluate segment results using certain non-GAAP measures. For additional information, see Supplemental Financial
Data on page 29. Table 10 provides selected summary financial data for our business segments and All Other for 2014 and 2013.
Table 10 Business Segment Results
Total Revenue (1)
Provision for Credit
Losses Noninterest Expense Net Income (Loss)
(Dollars in millions) 2014 2013 2014 2013 2014 2013 2014 2013
Consumer & Business Banking $ 29,862 $ 29,864 $ 2,633 $ 3,107 $ 15,911 $ 16,260 $ 7,096 $ 6,647
Consumer Real Estate Services 4,848 7,715 160 (156) 23,226 15,815 (13,395) (5,031)
Global Wealth & Investment Management 18,404 17,790 14 56 13,647 13,033 2,974 2,977
Global Banking 16,598 16,479 336 1,075 7,681 7,551 5,435 4,973
Global Markets 16,119 15,390 110 140 11,771 11,996 2,719 1,153
All Other (715) 2,563 (978) (666) 2,881 4,559 4712
Total FTE basis 85,116 89,801 2,275 3,556 75,117 69,214 4,833 11,431
FTE adjustment (869) (859) ——————
Total Consolidated $ 84,247 $ 88,942 $ 2,275 $ 3,556 $ 75,117 $ 69,214 $ 4,833 $ 11,431
(1) Total revenue is net of interest expense and is on an FTE basis which for consolidated revenue is a non-GAAP financial measure. For more information on this measure, see Supplemental Financial
Data on page 29, and for a corresponding reconciliation to a GAAP financial measure, see Statistical Table XV.
The Corporation periodically reviews capital allocated to its
businesses and allocates capital annually during the strategic and
capital planning processes. We utilize a methodology that
considers the effect of regulatory capital requirements in addition
to internal risk-based capital models. The Corporation’s internal
risk-based capital models use a risk-adjusted methodology
incorporating each segment’s credit, market, interest rate,
business and operational risk components. For more information
on the nature of these risks, see Managing Risk on page 52. The
capital allocated to the business segments is referred to as
allocated capital, which represents a non-GAAP financial measure.
For purposes of goodwill impairment testing, the Corporation
utilizes allocated equity as a proxy for the carrying value of its
reporting units. Allocated equity in the reporting units is comprised
of allocated capital plus capital for the portion of goodwill and
intangibles specifically assigned to the reporting unit. For
additional information, see Note 8 – Goodwill and Intangible Assets
to the Consolidated Financial Statements.
During 2014, we made refinements to the amount of capital
allocated to each of our businesses based on multiple
considerations that included, but were not limited to, Basel 3
Standardized and Advanced risk-weighted assets, business
segment exposures and risk profile, and strategic plans. As a result
of this process, in 2014, we adjusted the amount of capital being
allocated to our business segments. This change resulted in a
reduction of unallocated capital, which is included in All Other, and
an aggregate increase in the amount of capital being allocated to
the business segments, primarily Global Banking and Global
Markets.
For more information on the business segments and
reconciliations to consolidated total revenue, net income and year-
end total assets, see Note 24 – Business Segment Information to
the Consolidated Financial Statements.