Bank of America 2014 Annual Report Download - page 122
Download and view the complete annual report
Please find page 122 of the 2014 Bank of America annual report below. You can navigate through the pages in the report by either clicking on the pages listed below, or by using the keyword search tool below to find specific information within the annual report.-
 1
1 -
2
-
3
-
4
-
5
-
6
-
7
-
8
-
9
-
10
-
11
-
12
-
13
-
14
-
15
-
16
-
17
-
18
-
19
-
20
-
21
-
22
-
23
-
24
-
25
-
26
-
27
-
28
-
29
-
30
-
31
-
32
-
33
-
34
-
35
-
36
-
37
-
38
-
39
-
40
-
41
-
42
-
43
-
44
-
45
-
46
-
47
-
48
-
49
-
50
-
51
-
52
-
53
-
54
-
55
-
56
-
57
-
58
-
59
-
60
-
61
-
62
-
63
-
64
-
65
-
66
-
67
-
68
-
69
-
70
-
71
-
72
-
73
-
74
-
75
-
76
-
77
-
78
-
79
-
80
-
81
-
82
-
83
-
84
-
85
-
86
-
87
-
88
-
89
-
90
-
91
-
92
-
93
-
94
-
95
-
96
-
97
-
98
-
99
-
100
-
101
-
102
-
103
-
104
-
105
-
106
-
107
-
108
-
109
-
110
-
111
-
 112
112 -
 113
113 -
 114
114 -
 115
115 -
 116
116 -
 117
117 -
 118
118 -
 119
119 -
 120
120 -
 121
121 -
 122
122 -
 123
123 -
 124
124 -
 125
125 -
 126
126 -
 127
127 -
 128
128 -
 129
129 -
 130
130 -
 131
131 -
 132
132 -
133
-
134
-
135
-
136
-
137
-
138
-
139
-
140
-
141
-
142
-
143
-
144
-
145
-
146
-
147
-
148
-
149
-
150
-
151
-
152
-
153
-
154
-
155
-
156
-
157
-
158
-
159
-
160
-
161
-
162
-
163
-
164
-
165
-
166
-
167
-
168
-
169
-
170
-
171
-
172
-
173
-
174
-
175
-
176
-
177
-
178
-
179
-
180
-
181
-
182
-
183
-
184
-
185
-
186
-
187
-
188
-
189
-
190
-
191
-
192
-
193
-
194
-
195
-
196
-
197
-
198
-
199
-
200
-
201
-
202
-
203
-
204
-
205
-
206
-
207
-
208
-
209
-
210
-
211
-
212
-
213
-
214
-
215
-
216
-
217
-
218
-
219
-
220
-
221
-
222
-
223
-
224
-
225
-
226
-
227
-
228
-
229
-
230
-
231
-
232
-
233
-
234
-
235
-
236
-
237
-
238
-
239
-
240
-
241
-
242
-
243
-
244
-
245
-
246
-
247
-
248
-
249
-
250
-
251
-
252
-
253
-
254
-
255
-
256
-
257
-
258
-
259
-
260
-
261
-
262
-
263
-
264
-
265
-
266
-
267
-
268
-
269
-
270
-
271
-
272
 |
 |

120 Bank of America 2014
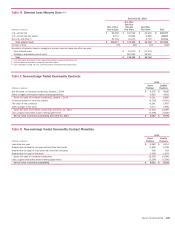
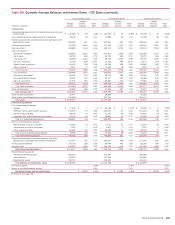
Table V Nonperforming Loans, Leases and Foreclosed Properties (1)
December 31
(Dollars in millions) 2014 2013 2012 2011 2010
Consumer
Residential mortgage $ 6,889 $ 11,712 $ 15,055 $ 16,259 $ 18,020
Home equity 3,901 4,075 4,282 2,454 2,696
Direct/Indirect consumer 28 35 92 40 90
Other consumer 118 21548
Total consumer (2) 10,819 15,840 19,431 18,768 20,854
Commercial
U.S. commercial 701 819 1,484 2,174 3,453
Commercial real estate 321 322 1,513 3,880 5,829
Commercial lease financing 316 44 26 117
Non-U.S. commercial 164 68 143 233
1,026 1,221 3,109 6,223 9,632
U.S. small business commercial 87 88 115 114 204
Total commercial (3) 1,113 1,309 3,224 6,337 9,836
Total nonperforming loans and leases 11,932 17,149 22,655 25,105 30,690
Foreclosed properties 697 623 900 2,603 1,974
Total nonperforming loans, leases and foreclosed properties $ 12,629 $ 17,772 $ 23,555 $ 27,708 $ 32,664
(1) Balances do not include PCI loans even though the customer may be contractually past due. PCI loans were recorded at fair value upon acquisition and accrete interest income over the remaining
life of the loan. In addition, balances do not include foreclosed properties that are insured by the FHA and have entered foreclosure of $1.1 billion, $1.4 billion, $2.5 billion and $1.4 billion at
December 31, 2014, 2013, 2012 and 2011, respectively.
(2) In 2014, $1.8 billion in interest income was estimated to be contractually due on $10.8 billion of consumer loans and leases classified as nonperforming, at December 31, 2104, as presented in
the table above, plus $20.6 billion of TDRs classified as performing at December 31, 2014. Approximately $960 million of the estimated $1.8 billion in contractual interest was received and included
in interest income for 2014.
(3) In 2014, $110 million in interest income was estimated to be contractually due on $1.1 billion of commercial loans and leases classified as nonperforming, at December 31, 2014, as presented
in the table above, plus $1.1 billion of TDRs classified as performing at December 31, 2014. Approximately $66 million of the estimated $110 million in contractual interest was received and included
in interest income for 2014.