Bank of America 2014 Annual Report Download - page 247
Download and view the complete annual report
Please find page 247 of the 2014 Bank of America annual report below. You can navigate through the pages in the report by either clicking on the pages listed below, or by using the keyword search tool below to find specific information within the annual report.-
 1
1 -
2
-
3
-
4
-
5
-
6
-
7
-
8
-
9
-
10
-
11
-
12
-
13
-
14
-
15
-
16
-
17
-
18
-
19
-
20
-
21
-
22
-
23
-
24
-
25
-
26
-
27
-
28
-
29
-
30
-
31
-
32
-
33
-
34
-
35
-
36
-
37
-
38
-
39
-
40
-
41
-
42
-
43
-
44
-
45
-
46
-
47
-
48
-
49
-
50
-
51
-
52
-
53
-
54
-
55
-
56
-
57
-
58
-
59
-
60
-
61
-
62
-
63
-
64
-
65
-
66
-
67
-
68
-
69
-
70
-
71
-
72
-
73
-
74
-
75
-
76
-
77
-
78
-
79
-
80
-
81
-
82
-
83
-
84
-
85
-
86
-
87
-
88
-
89
-
90
-
91
-
92
-
93
-
94
-
95
-
96
-
97
-
98
-
99
-
100
-
101
-
102
-
103
-
104
-
105
-
106
-
107
-
108
-
109
-
110
-
111
-
112
-
113
-
114
-
115
-
116
-
117
-
118
-
119
-
120
-
121
-
122
-
123
-
124
-
125
-
126
-
127
-
128
-
129
-
130
-
131
-
132
-
133
-
134
-
135
-
136
-
137
-
138
-
139
-
140
-
141
-
142
-
143
-
144
-
145
-
146
-
147
-
148
-
149
-
150
-
151
-
152
-
153
-
154
-
155
-
156
-
157
-
158
-
159
-
160
-
161
-
162
-
163
-
164
-
165
-
166
-
167
-
168
-
169
-
170
-
171
-
172
-
173
-
174
-
175
-
176
-
177
-
178
-
179
-
180
-
181
-
182
-
183
-
184
-
185
-
186
-
187
-
188
-
189
-
190
-
191
-
192
-
193
-
194
-
195
-
196
-
197
-
198
-
199
-
200
-
201
-
202
-
203
-
204
-
205
-
206
-
207
-
208
-
209
-
210
-
211
-
212
-
213
-
214
-
215
-
216
-
217
-
218
-
219
-
220
-
221
-
222
-
223
-
224
-
225
-
226
-
227
-
228
-
229
-
230
-
231
-
232
-
233
-
234
-
235
-
236
-
 237
237 -
 238
238 -
 239
239 -
 240
240 -
 241
241 -
 242
242 -
 243
243 -
 244
244 -
 245
245 -
 246
246 -
 247
247 -
 248
248 -
 249
249 -
 250
250 -
 251
251 -
 252
252 -
 253
253 -
 254
254 -
 255
255 -
 256
256 -
 257
257 -
258
-
259
-
260
-
261
-
262
-
263
-
264
-
265
-
266
-
267
-
268
-
269
-
270
-
271
-
272
 |
 |

Bank of America 2014 245
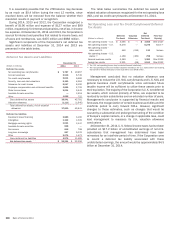
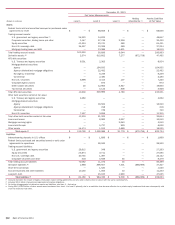
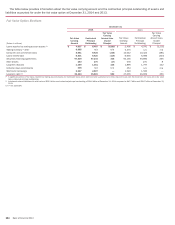
Level 3 – Fair Value Measurements (1)
2012
Gross
(Dollars in millions)
Balance
January 1
2012
Gains
(Losses)
in Earnings
Gains
(Losses)
in OCI Purchases Sales Issuances Settlements
Gross
Transfers
into
Level 3
Gross
Transfers
out of
Level 3
Balance
December 31
2012
Trading account assets:
Corporate securities, trading loans and
other (2) $ 6,880 $ 195 $ — $ 2,798 $ (4,556) $ — $ (1,077) $ 436 $ (950) $ 3,726
Equity securities 544 31 — 201 (271) — 27 90 (77) 545
Non-U.S. sovereign debt 342 8 — 388 (359) — (5) — (21) 353
Mortgage trading loans and ABS (2) 3,689 215 — 2,574 (1,536) — (678) 844 (173) 4,935
Total trading account assets 11,455 449 — 5,961 (6,722) — (1,733) 1,370 (1,221) 9,559
Net derivative assets (3) 5,866 (221) — 893 (1,012) — (3,328) (269) (461) 1,468
AFS debt securities:
Mortgage-backed securities:
Agency 37 — — — — — (4) — (33) —
Non-agency residential 860 (69) 19 — (306) — (2) — (502) —
Non-agency commercial 40 — — — (24) — (6) — — 10
Corporate/Agency bonds 162 (2) — (2) — — (39) — (27) 92
Other taxable securities 4,265 23 26 3,196 (28) — (3,345) — (209) 3,928
Tax-exempt securities 2,648 61 20 — (133) — (1,535) — — 1,061
Total AFS debt securities 8,012 13 65 3,194 (491) — (4,931) — (771) 5,091
Loans and leases (4, 5) 2,744 334 — 564 (1,520) — (274) 450 (11) 2,287
Mortgage servicing rights (5) 7,378 (430) — — (122) 374 (1,484) — — 5,716
Loans held-for-sale (4) 3,387 352 — 794 (834) — (414) 80 (632) 2,733
Other assets (6) 4,235 (54) — 109 (1,039) 270 (381) — (11) 3,129
Trading account liabilities – Corporate
securities and other (114) 4 — 116 (136) — 80 (68) 54 (64)
Short-term borrowings (4) — — — — — (232) 232 — — —
Accrued expenses and other liabilities (4) (14) (4) — 8 — (9) — — 4 (15)
Long-term debt (4) (2,943) (307) — 290 (33) (259) 1,239 (2,040) 1,752 (2,301)
(1) Assets (liabilities). For assets, increase (decrease) to Level 3 and for liabilities, (increase) decrease to Level 3.
(2) During 2012, approximately $900 million was reclassified from Trading account assets – Corporate securities, trading loans and other to Trading account assets – Mortgage trading loans and ABS.
In the table above, this reclassification is presented as a sale of Trading account assets – Corporate securities, trading loans and other and as a purchase of Trading account assets – Mortgage
trading loans and ABS.
(3) Net derivatives include derivative assets of $8.1 billion and derivative liabilities of $6.6 billion.
(4) Amounts represent instruments that are accounted for under the fair value option.
(5) Issuances represent loan originations and mortgage servicing rights retained following securitizations or whole-loan sales.
(6) Other assets is primarily comprised of net monoline exposure to a single counterparty and private equity investments.
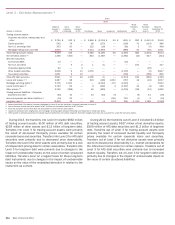
During 2012, the transfers into Level 3 included $1.4 billion of
trading account assets, $269 million of net derivative assets,
$450 million of loans and leases and $2.0 billion of long-term
debt. Transfers into Level 3 for trading account assets were
primarily the result of decreased market liquidity for certain
corporate loans and updated information related to certain CLOs.
Transfers into Level 3 for net derivative assets were primarily
related to decreased price observability for certain long-dated
equity derivative liabilities due to a lack of independent pricing.
Transfers into Level 3 for loans and leases were due to updated
information related to certain commercial loans. Transfers into
Level 3 for long-term debt were primarily due to changes in the
impact of unobservable inputs on the value of certain structured
liabilities. Transfers occur on a regular basis for these long-term
debt instruments due to changes in the impact of unobservable
inputs on the value of the embedded derivative in relation to the
instrument as a whole.
During 2012, the transfers out of Level 3 included $1.2 billion
of trading account assets, $461 million of net derivative assets,
$771 million of AFS debt securities, $632 million of LHFS and
$1.8 billion of long-term debt. Transfers out of Level 3 for trading
account assets were primarily related to increased market liquidity
for certain corporate and commercial real estate loans. Transfers
out of Level 3 for net derivative assets were primarily related to
increased price observability (i.e., market comparables for the
referenced instruments) for certain total return swaps and foreign
exchange swaps. Transfers out of Level 3 for AFS debt securities
were primarily related to increased price observability for certain
non-agency RMBS and ABS. Transfers out of Level 3 for LHFS were
primarily related to increased observable inputs, primarily liquid
comparables. Transfers out of Level 3 for long-term debt were
primarily due to changes in the impact of unobservable inputs on
the value of certain structured liabilities.