Bank of America 2014 Annual Report Download - page 77
Download and view the complete annual report
Please find page 77 of the 2014 Bank of America annual report below. You can navigate through the pages in the report by either clicking on the pages listed below, or by using the keyword search tool below to find specific information within the annual report.-
 1
1 -
2
-
3
-
4
-
5
-
6
-
7
-
8
-
9
-
10
-
11
-
12
-
13
-
14
-
15
-
16
-
17
-
18
-
19
-
20
-
21
-
22
-
23
-
24
-
25
-
26
-
27
-
28
-
29
-
30
-
31
-
32
-
33
-
34
-
35
-
36
-
37
-
38
-
39
-
40
-
41
-
42
-
43
-
44
-
45
-
46
-
47
-
48
-
49
-
50
-
51
-
52
-
53
-
54
-
55
-
56
-
57
-
58
-
59
-
60
-
61
-
62
-
63
-
64
-
65
-
66
-
 67
67 -
 68
68 -
 69
69 -
 70
70 -
 71
71 -
 72
72 -
 73
73 -
 74
74 -
 75
75 -
 76
76 -
 77
77 -
 78
78 -
 79
79 -
 80
80 -
 81
81 -
 82
82 -
 83
83 -
 84
84 -
 85
85 -
 86
86 -
 87
87 -
88
-
89
-
90
-
91
-
92
-
93
-
94
-
95
-
96
-
97
-
98
-
99
-
100
-
101
-
102
-
103
-
104
-
105
-
106
-
107
-
108
-
109
-
110
-
111
-
112
-
113
-
114
-
115
-
116
-
117
-
118
-
119
-
120
-
121
-
122
-
123
-
124
-
125
-
126
-
127
-
128
-
129
-
130
-
131
-
132
-
133
-
134
-
135
-
136
-
137
-
138
-
139
-
140
-
141
-
142
-
143
-
144
-
145
-
146
-
147
-
148
-
149
-
150
-
151
-
152
-
153
-
154
-
155
-
156
-
157
-
158
-
159
-
160
-
161
-
162
-
163
-
164
-
165
-
166
-
167
-
168
-
169
-
170
-
171
-
172
-
173
-
174
-
175
-
176
-
177
-
178
-
179
-
180
-
181
-
182
-
183
-
184
-
185
-
186
-
187
-
188
-
189
-
190
-
191
-
192
-
193
-
194
-
195
-
196
-
197
-
198
-
199
-
200
-
201
-
202
-
203
-
204
-
205
-
206
-
207
-
208
-
209
-
210
-
211
-
212
-
213
-
214
-
215
-
216
-
217
-
218
-
219
-
220
-
221
-
222
-
223
-
224
-
225
-
226
-
227
-
228
-
229
-
230
-
231
-
232
-
233
-
234
-
235
-
236
-
237
-
238
-
239
-
240
-
241
-
242
-
243
-
244
-
245
-
246
-
247
-
248
-
249
-
250
-
251
-
252
-
253
-
254
-
255
-
256
-
257
-
258
-
259
-
260
-
261
-
262
-
263
-
264
-
265
-
266
-
267
-
268
-
269
-
270
-
271
-
272
 |
 |

Bank of America 2014 75
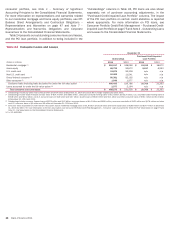
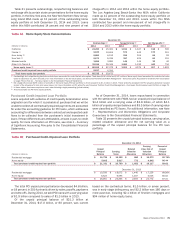
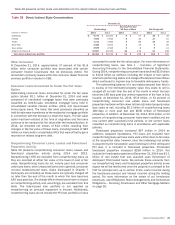
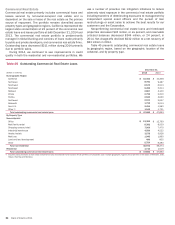
Table 31 presents outstandings, nonperforming balances and
net charge-offs by certain state concentrations for the home equity
portfolio. In the New York area, the New York-Northern New Jersey-
Long Island MSA made up 12 percent of the outstanding home
equity portfolio at both December 31, 2014 and 2013. Loans
within this MSA contributed 14 percent and nine percent of net
charge-offs in 2014 and 2013 within the home equity portfolio.
The Los Angeles-Long Beach-Santa Ana MSA within California
made up 12 percent of the outstanding home equity portfolio at
both December 31, 2014 and 2013. Loans within this MSA
contributed four percent and nine percent of net charge-offs in
2014 and 2013 within the home equity portfolio.
Table 31 Home Equity State Concentrations
December 31
Outstandings (1) Nonperforming (1) Net Charge-offs (2)
(Dollars in millions) 2014 2013 2014 2013 2014 2013
California $ 23,250 $ 25,061 $ 1,012 $ 1,047 $118 $ 509
Florida (3) 9,633 10,604 574 643 170 315
New Jersey (3) 5,883 6,153 299 304 68 93
New York (3) 5,671 6,035 387 405 81 110
Massachusetts 3,655 3,881 148 144 30 42
Other U.S./Non-U.S. 32,016 35,345 1,481 1,532 440 734
Home equity loans (4) $ 80,108 $ 87,079 $ 3,901 $ 4,075 $907 $ 1,803
Purchased credit-impaired home equity portfolio 5,617 6,593
Total home equity loan portfolio $ 85,725 $ 93,672
(1) Outstandings and nonperforming amounts exclude loans accounted for under the fair value option. There were $196 million and $147 million of home equity loans accounted for under the fair value
option at December 31, 2014 and 2013. For more information on the fair value option, see Consumer Portfolio Credit Risk Management – Consumer Loans Accounted for Under the Fair Value Option
on page 79 and Note 21 – Fair Value Option to the Consolidated Financial Statements.
(2) Net charge-offs exclude $265 million of write-offs in the home equity PCI loan portfolio in 2014 compared to $1.2 billion in 2013. These write-offs decreased the PCI valuation allowance included
as part of the allowance for loan and lease losses. For more information on PCI write-offs, see Consumer Portfolio Credit Risk Management – Purchased Credit-impaired Loan Portfolio on page 75.
(3) In these states, foreclosure requires a court order following a legal proceeding (judicial states).
(4) Amount excludes the PCI home equity portfolio.
Purchased Credit-impaired Loan Portfolio
Loans acquired with evidence of credit quality deterioration since
origination and for which it is probable at purchase that we will be
unable to collect all contractually required payments are accounted
for under the accounting guidance for PCI loans, which addresses
accounting for differences between contractual and expected cash
flows to be collected from the purchaser’s initial investment in
loans if those differences are attributable, at least in part, to credit
quality. For more information on PCI loans, see Note 1 – Summary
of Significant Accounting Principles to the Consolidated Financial
Statements.
As of December 31, 2014, loans repurchased in connection
with the settlement with FNMA had an unpaid principal balance of
$4.4 billion and a carrying value of $3.8 billion, of which $4.1
billion of unpaid principal balance and $3.5 billion of carrying value
were classified as PCI loans. For additional information, see Note
7 – Representations and Warranties Obligations and Corporate
Guarantees to the Consolidated Financial Statements.
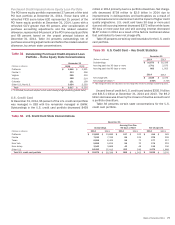
Table 32 presents the unpaid principal balance, carrying value,
related valuation allowance and the net carrying value as a
percentage of the unpaid principal balance for the PCI loan
portfolio.
Table 32 Purchased Credit-impaired Loan Portfolio
December 31, 2014
(Dollars in millions)
Unpaid
Principal
Balance
Carrying
Value
Related
Valuation
Allowance
Carrying
Value Net of
Valuation
Allowance
Percent of
Unpaid
Principal
Balance
Residential mortgage $ 15,726 $ 15,152 $ 880 $14,272 90.75%
Home equity 5,605 5,617 772 4,845 86.44
Total purchased credit-impaired loan portfolio $ 21,331 $ 20,769 $ 1,652 $ 19,117 89.62
December 31, 2013
Residential mortgage $ 19,558 $ 18,672 $ 1,446 $ 17,226 88.08%
Home equity 6,523 6,593 1,047 5,546 85.02
Total purchased credit-impaired loan portfolio $ 26,081 $ 25,265 $ 2,493 $ 22,772 87.31
The total PCI unpaid principal balance decreased $4.8 billion,
or 18 percent, in 2014 primarily driven by sales, payoffs, paydowns
and write-offs. During 2014, we sold PCI loans with a carrying value
of $1.9 billion compared to sales of $1.3 billion in 2013.
Of the unpaid principal balance of $21.3 billion at
December 31, 2014, $17.0 billion, or 80 percent, was current
based on the contractual terms, $1.5 billion, or seven percent,
was in early stage delinquency, and $2.2 billion was 180 days or
more past due, including $2.1 billion of first-lien mortgages and
$94 million of home equity loans.