Bank of America 2014 Annual Report Download - page 38
Download and view the complete annual report
Please find page 38 of the 2014 Bank of America annual report below. You can navigate through the pages in the report by either clicking on the pages listed below, or by using the keyword search tool below to find specific information within the annual report.-
 1
1 -
2
-
3
-
4
-
5
-
6
-
7
-
8
-
9
-
10
-
11
-
12
-
13
-
14
-
15
-
16
-
17
-
18
-
19
-
20
-
21
-
22
-
23
-
24
-
25
-
26
-
27
-
 28
28 -
 29
29 -
 30
30 -
 31
31 -
 32
32 -
 33
33 -
 34
34 -
 35
35 -
 36
36 -
 37
37 -
 38
38 -
 39
39 -
 40
40 -
 41
41 -
 42
42 -
 43
43 -
 44
44 -
 45
45 -
 46
46 -
 47
47 -
 48
48 -
49
-
50
-
51
-
52
-
53
-
54
-
55
-
56
-
57
-
58
-
59
-
60
-
61
-
62
-
63
-
64
-
65
-
66
-
67
-
68
-
69
-
70
-
71
-
72
-
73
-
74
-
75
-
76
-
77
-
78
-
79
-
80
-
81
-
82
-
83
-
84
-
85
-
86
-
87
-
88
-
89
-
90
-
91
-
92
-
93
-
94
-
95
-
96
-
97
-
98
-
99
-
100
-
101
-
102
-
103
-
104
-
105
-
106
-
107
-
108
-
109
-
110
-
111
-
112
-
113
-
114
-
115
-
116
-
117
-
118
-
119
-
120
-
121
-
122
-
123
-
124
-
125
-
126
-
127
-
128
-
129
-
130
-
131
-
132
-
133
-
134
-
135
-
136
-
137
-
138
-
139
-
140
-
141
-
142
-
143
-
144
-
145
-
146
-
147
-
148
-
149
-
150
-
151
-
152
-
153
-
154
-
155
-
156
-
157
-
158
-
159
-
160
-
161
-
162
-
163
-
164
-
165
-
166
-
167
-
168
-
169
-
170
-
171
-
172
-
173
-
174
-
175
-
176
-
177
-
178
-
179
-
180
-
181
-
182
-
183
-
184
-
185
-
186
-
187
-
188
-
189
-
190
-
191
-
192
-
193
-
194
-
195
-
196
-
197
-
198
-
199
-
200
-
201
-
202
-
203
-
204
-
205
-
206
-
207
-
208
-
209
-
210
-
211
-
212
-
213
-
214
-
215
-
216
-
217
-
218
-
219
-
220
-
221
-
222
-
223
-
224
-
225
-
226
-
227
-
228
-
229
-
230
-
231
-
232
-
233
-
234
-
235
-
236
-
237
-
238
-
239
-
240
-
241
-
242
-
243
-
244
-
245
-
246
-
247
-
248
-
249
-
250
-
251
-
252
-
253
-
254
-
255
-
256
-
257
-
258
-
259
-
260
-
261
-
262
-
263
-
264
-
265
-
266
-
267
-
268
-
269
-
270
-
271
-
272
 |
 |
36 Bank of America 2014
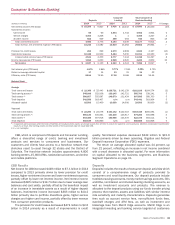
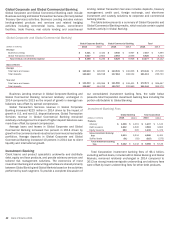
noninterest expense decreased $4.0 billion to $8.0 billion driven
by a decline in default-related servicing expenses, including
mortgage-related assessments, waivers and similar costs related
to foreclosure delays in Legacy Assets & Servicing and a decline
in personnel expense resulting from lower loan originations in
Home Loans.
Home Loans
Home Loans products are available to our customers through our
retail network, direct telephone and online access delivered by a
sales force of nearly 2,500 mortgage loan officers, including 1,500
banking center mortgage loan officers covering 2,600 banking
centers, and a nearly 700-person centralized sales force based in
five call centers.
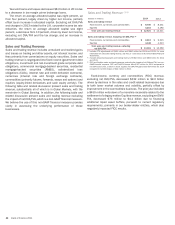
The net loss for Home Loans increased $155 million to a net
loss of $283 million driven by lower mortgage banking income,
partially offset by lower noninterest expense and lower provision
for credit losses. Mortgage banking income decreased $1.1 billion
due to a decline in core production revenue as a result of lower
first mortgage origination volumes, and to a lesser extent, industry-
wide margin compression. The provision for credit losses
decreased $94 million reflecting continued improvement in
portfolio trends including increased home prices. Noninterest
expense decreased $747 million primarily due to lower personnel
expense resulting from lower loan originations.
Legacy Assets & Servicing
Legacy Assets & Servicing is responsible for all of our in-house
servicing activities related to the residential mortgage and home
equity loan portfolios, including owned loans and loans serviced
for others (collectively, the mortgage serviced portfolio). A portion
of this portfolio has been designated as the Legacy Serviced
Portfolio, which represented 26 percent, 30 percent and 39
percent of the total mortgage serviced portfolio, as measured by
unpaid principal balance, at December 31, 2014, 2013 and 2012,
respectively. In addition, Legacy Assets & Servicing is responsible
for managing subservicing agreements.
Legacy Assets & Servicing results reflect the net cost of legacy
exposures that are included in the results of CRES, including
representations and warranties provision, litigation expense,
financial results of the CRES home equity portfolio selected as
part of the Legacy Owned Portfolio, the financial results of the
servicing operations and the results of MSR activities, including
net hedge results. The financial results of the servicing operations
reflect certain revenues and expenses on loans serviced for
others, including owned loans serviced for Home Loans, GWIM
and All Other.
Servicing activities include collecting cash for principal,
interest and escrow payments from borrowers, disbursing
customer draws for lines of credit, accounting for and remitting
principal and interest payments to investors and escrow payments
to third parties, and responding to customer inquiries. Our home
retention efforts, including single point of contact resources, are
also part of our servicing activities, along with supervision of
foreclosures and property dispositions. Prior to foreclosure,
Legacy Assets & Servicing evaluates various workout options in
an effort to help our customers avoid foreclosure. For more
information on our servicing activities, including the impact of
foreclosure delays, see Off-Balance Sheet Arrangements and
Contractual Obligations – Servicing, Foreclosure and Other
Mortgage Matters on page 50.
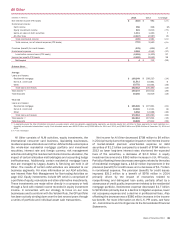
The net loss for Legacy Assets & Servicing increased $8.2
billion to a net loss of $13.1 billion driven by higher litigation
expense, which is included in noninterest expense, a lower tax
benefit rate resulting from the non-deductible treatment of a
portion of the settlement with the DoJ, lower mortgage banking
income and higher provision for credit losses.
Mortgage banking income decreased $1.6 billion primarily
driven by a decline in servicing income due to a smaller servicing
portfolio combined with less favorable MSR net-of-hedge
performance. The provision for credit losses increased $410
million primarily due to additional costs associated with the
consumer relief portion of the settlement with the DoJ.
Noninterest expense increased $8.2 billion due to higher
litigation expense as a result of the settlements with the DoJ and
FHFA. Excluding litigation, noninterest expense decreased $3.3
billion to $5.4 billion driven by a decrease in default-related
servicing expenses, including mortgage-related assessments,
waivers and similar costs related to foreclosure delays. We expect
that noninterest expense in Legacy Assets & Servicing, excluding
litigation expense, will decline to approximately $800 million per
quarter by the end of 2015.
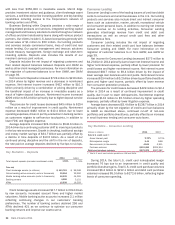
Legacy Portfolios
The Legacy Portfolios (both owned and serviced) include those
loans originated prior to January 1, 2011 that would not have been
originated under our established underwriting standards in place
as of December 31, 2010. The purchased credit-impaired (PCI)
portfolio, as well as certain loans that met a pre-defined
delinquency status or probability of default threshold as of January
1, 2011, are also included in the Legacy Portfolios. Since
determining the pool of loans to be included in the Legacy Portfolios
as of January 1, 2011, the criteria have not changed for these
portfolios, but will continue to be evaluated over time.
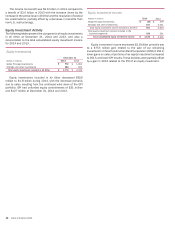
Legacy Owned Portfolio
The Legacy Owned Portfolio includes those loans that met the
criteria as described above and are on the balance sheet of the
Corporation. The home equity loan portfolio is held on the balance
sheet of Legacy Assets & Servicing, and the residential mortgage
loan portfolio is held on the balance sheet of All Other. The financial
results of the on-balance sheet loans are reported in the segment
that owns the loans or in All Other. Total loans in the Legacy Owned
Portfolio decreased $22.2 billion in 2014 to $89.9 billion at
December 31, 2014, of which $33.1 billion were held on the
Legacy Assets & Servicing balance sheet and the remainder was
held on the balance sheet of All Other. The decrease was primarily
related to paydowns, loan sales, PCI write-offs and charge-offs.