Bank of America 2014 Annual Report Download - page 88
Download and view the complete annual report
Please find page 88 of the 2014 Bank of America annual report below. You can navigate through the pages in the report by either clicking on the pages listed below, or by using the keyword search tool below to find specific information within the annual report.-
 1
1 -
2
-
3
-
4
-
5
-
6
-
7
-
8
-
9
-
10
-
11
-
12
-
13
-
14
-
15
-
16
-
17
-
18
-
19
-
20
-
21
-
22
-
23
-
24
-
25
-
26
-
27
-
28
-
29
-
30
-
31
-
32
-
33
-
34
-
35
-
36
-
37
-
38
-
39
-
40
-
41
-
42
-
43
-
44
-
45
-
46
-
47
-
48
-
49
-
50
-
51
-
52
-
53
-
54
-
55
-
56
-
57
-
58
-
59
-
60
-
61
-
62
-
63
-
64
-
65
-
66
-
67
-
68
-
69
-
70
-
71
-
72
-
73
-
74
-
75
-
76
-
77
-
 78
78 -
 79
79 -
 80
80 -
 81
81 -
 82
82 -
 83
83 -
 84
84 -
 85
85 -
 86
86 -
 87
87 -
 88
88 -
 89
89 -
 90
90 -
 91
91 -
 92
92 -
 93
93 -
 94
94 -
 95
95 -
 96
96 -
 97
97 -
 98
98 -
99
-
100
-
101
-
102
-
103
-
104
-
105
-
106
-
107
-
108
-
109
-
110
-
111
-
112
-
113
-
114
-
115
-
116
-
117
-
118
-
119
-
120
-
121
-
122
-
123
-
124
-
125
-
126
-
127
-
128
-
129
-
130
-
131
-
132
-
133
-
134
-
135
-
136
-
137
-
138
-
139
-
140
-
141
-
142
-
143
-
144
-
145
-
146
-
147
-
148
-
149
-
150
-
151
-
152
-
153
-
154
-
155
-
156
-
157
-
158
-
159
-
160
-
161
-
162
-
163
-
164
-
165
-
166
-
167
-
168
-
169
-
170
-
171
-
172
-
173
-
174
-
175
-
176
-
177
-
178
-
179
-
180
-
181
-
182
-
183
-
184
-
185
-
186
-
187
-
188
-
189
-
190
-
191
-
192
-
193
-
194
-
195
-
196
-
197
-
198
-
199
-
200
-
201
-
202
-
203
-
204
-
205
-
206
-
207
-
208
-
209
-
210
-
211
-
212
-
213
-
214
-
215
-
216
-
217
-
218
-
219
-
220
-
221
-
222
-
223
-
224
-
225
-
226
-
227
-
228
-
229
-
230
-
231
-
232
-
233
-
234
-
235
-
236
-
237
-
238
-
239
-
240
-
241
-
242
-
243
-
244
-
245
-
246
-
247
-
248
-
249
-
250
-
251
-
252
-
253
-
254
-
255
-
256
-
257
-
258
-
259
-
260
-
261
-
262
-
263
-
264
-
265
-
266
-
267
-
268
-
269
-
270
-
271
-
272
 |
 |
86 Bank of America 2014
development loans totaled $164 million and $431 million, and
nonperforming construction and land development loans and
foreclosed properties totaled $80 million and $100 million at
December 31, 2014 and 2013. During a property’s construction
phase, interest income is typically paid from interest reserves that
are established at the inception of the loan. As construction is
completed and the property is put into service, these interest
reserves are depleted and interest payments from operating cash
flows begin. We do not recognize interest income on nonperforming
loans regardless of the existence of an interest reserve.
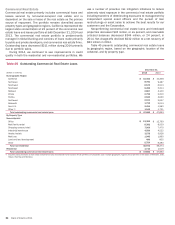
Non-U.S. Commercial
At December 31, 2014, 77 percent of the non-U.S. commercial
loan portfolio was managed in Global Banking and 23 percent in
Global Markets. Outstanding loans, excluding loans accounted for
under the fair value option, decreased $9.4 billion in 2014 primarily
due to client financing activity including prime brokerage loans.
Net charge-offs decreased $11 million to $34 million in 2014. For
more information on the non-U.S. commercial portfolio, see Non-
U.S. Portfolio on page 90.
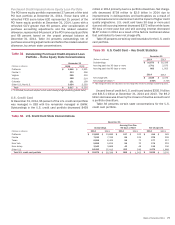
U.S. Small Business Commercial
The U.S. small business commercial loan portfolio is comprised
of small business card loans and small business loans managed
in CBB. Credit card-related products were 43 percent of the U.S.
small business commercial portfolio at both December 31, 2014
and 2013. Net charge-offs decreased $77 million to $282 million
in 2014 driven by an improvement in credit quality, including lower
delinquencies as a result of an improved economic environment,
and the impact of higher credit quality originations. Of the U.S.
small business commercial net charge-offs, 73 percent were credit
card-related products in both 2014 and 2013.
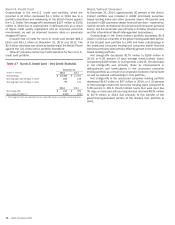
Commercial Loans Accounted for Under the Fair Value
Option
The portfolio of commercial loans accounted for under the fair
value option is held primarily in Global Markets and Global Banking.
Outstanding commercial loans accounted for under the fair value
option decreased $1.3 billion to an aggregate fair value of $6.6
billion at December 31, 2014 primarily due to decreased corporate
borrowings under bank credit facilities. We recorded net losses of
$11 million in 2014 compared to net gains of $88 million in 2013
from changes in the fair value of this loan portfolio. These amounts
were primarily attributable to changes in instrument-specific credit
risk, were recorded in other income (loss) and do not reflect the
results of hedging activities.
In addition, unfunded lending commitments and letters of credit
accounted for under the fair value option had an aggregate fair
value of $405 million and $354 million at December 31, 2014
and 2013, which was recorded in accrued expenses and other
liabilities. The associated aggregate notional amount of unfunded
lending commitments and letters of credit accounted for under the
fair value option was $9.9 billion and $13.0 billion at
December 31, 2014 and 2013. We recorded net losses of $64
million from changes in the fair value of commitments and letters
of credit during 2014 compared to net gains of $180 million in
2013. These amounts were primarily attributable to changes in
instrument-specific credit risk, were recorded in other income
(loss) and do not reflect the results of hedging activities.
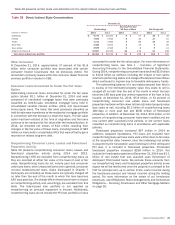
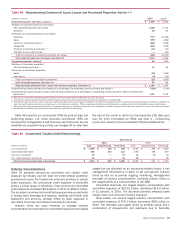
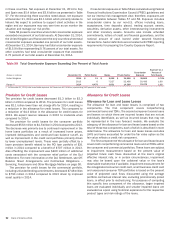
Nonperforming Commercial Loans, Leases and
Foreclosed Properties Activity
Table 48 presents the nonperforming commercial loans, leases
and foreclosed properties activity during 2014 and 2013.
Nonperforming loans do not include loans accounted for under the
fair value option. During 2014, nonperforming commercial loans
and leases decreased $196 million to $1.1 billion driven by
paydowns, charge-offs and returns to performing status outpacing
new nonperforming loans. Approximately 98 percent of commercial
nonperforming loans, leases and foreclosed properties were
secured and approximately 45 percent were contractually current.
Commercial nonperforming loans were carried at approximately
79 percent of their unpaid principal balance before consideration
of the allowance for loan and lease losses as the carrying value
of these loans has been reduced to the estimated property value
less costs to sell.