Bank of America 2014 Annual Report Download - page 175
Download and view the complete annual report
Please find page 175 of the 2014 Bank of America annual report below. You can navigate through the pages in the report by either clicking on the pages listed below, or by using the keyword search tool below to find specific information within the annual report.-
 1
1 -
2
-
3
-
4
-
5
-
6
-
7
-
8
-
9
-
10
-
11
-
12
-
13
-
14
-
15
-
16
-
17
-
18
-
19
-
20
-
21
-
22
-
23
-
24
-
25
-
26
-
27
-
28
-
29
-
30
-
31
-
32
-
33
-
34
-
35
-
36
-
37
-
38
-
39
-
40
-
41
-
42
-
43
-
44
-
45
-
46
-
47
-
48
-
49
-
50
-
51
-
52
-
53
-
54
-
55
-
56
-
57
-
58
-
59
-
60
-
61
-
62
-
63
-
64
-
65
-
66
-
67
-
68
-
69
-
70
-
71
-
72
-
73
-
74
-
75
-
76
-
77
-
78
-
79
-
80
-
81
-
82
-
83
-
84
-
85
-
86
-
87
-
88
-
89
-
90
-
91
-
92
-
93
-
94
-
95
-
96
-
97
-
98
-
99
-
100
-
101
-
102
-
103
-
104
-
105
-
106
-
107
-
108
-
109
-
110
-
111
-
112
-
113
-
114
-
115
-
116
-
117
-
118
-
119
-
120
-
121
-
122
-
123
-
124
-
125
-
126
-
127
-
128
-
129
-
130
-
131
-
132
-
133
-
134
-
135
-
136
-
137
-
138
-
139
-
140
-
141
-
142
-
143
-
144
-
145
-
146
-
147
-
148
-
149
-
150
-
151
-
152
-
153
-
154
-
155
-
156
-
157
-
158
-
159
-
160
-
161
-
162
-
163
-
164
-
 165
165 -
 166
166 -
 167
167 -
 168
168 -
 169
169 -
 170
170 -
 171
171 -
 172
172 -
 173
173 -
 174
174 -
 175
175 -
 176
176 -
 177
177 -
 178
178 -
 179
179 -
 180
180 -
 181
181 -
 182
182 -
 183
183 -
 184
184 -
 185
185 -
186
-
187
-
188
-
189
-
190
-
191
-
192
-
193
-
194
-
195
-
196
-
197
-
198
-
199
-
200
-
201
-
202
-
203
-
204
-
205
-
206
-
207
-
208
-
209
-
210
-
211
-
212
-
213
-
214
-
215
-
216
-
217
-
218
-
219
-
220
-
221
-
222
-
223
-
224
-
225
-
226
-
227
-
228
-
229
-
230
-
231
-
232
-
233
-
234
-
235
-
236
-
237
-
238
-
239
-
240
-
241
-
242
-
243
-
244
-
245
-
246
-
247
-
248
-
249
-
250
-
251
-
252
-
253
-
254
-
255
-
256
-
257
-
258
-
259
-
260
-
261
-
262
-
263
-
264
-
265
-
266
-
267
-
268
-
269
-
270
-
271
-
272
 |
 |

Bank of America 2014 173
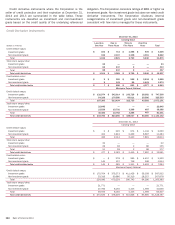
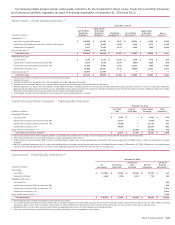
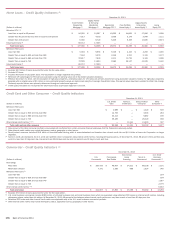
December 31, 2013
(Dollars in millions)
30-59 Days
Past Due (1)
60-89 Days
Past Due (1)
90 Days or
More
Past Due (2)
Total Past
Due 30
Days
or More
Total
Current or
Less Than
30 Days
Past Due (3)
Purchased
Credit-
impaired (4)
Loans
Accounted
for Under
the Fair
Value Option
Total
Outstandings
Home loans
Core portfolio
Residential mortgage $ 2,151 $ 754 $ 7,188 $ 10,093 $ 167,243 $ 177,336
Home equity 243 113 693 1,049 53,450 54,499
Legacy Assets & Servicing portfolio
Residential mortgage (5) 2,758 1,412 16,746 20,916 31,142 $ 18,672 70,730
Home equity 444 221 1,292 1,957 30,623 6,593 39,173
Credit card and other consumer
U.S. credit card 598 422 1,053 2,073 90,265 92,338
Non-U.S. credit card 63 54 131 248 11,293 11,541
Direct/Indirect consumer (6) 431 175 410 1,016 81,176 82,192
Other consumer (7) 24 8 20 52 1,925 1,977
Total consumer 6,712 3,159 27,533 37,404 467,117 25,265 529,786
Consumer loans accounted for under
the fair value option (8) $ 2,164 2,164
Total consumer loans and leases 6,712 3,159 27,533 37,404 467,117 25,265 2,164 531,950
Commercial
U.S. commercial 363 151 309 823 211,734 212,557
Commercial real estate (9) 30 29 243 302 47,591 47,893
Commercial lease financing 110 37 48 195 25,004 25,199
Non-U.S. commercial 103 8 17 128 89,334 89,462
U.S. small business commercial 87 55 113 255 13,039 13,294
Total commercial 693 280 730 1,703 386,702 388,405
Commercial loans accounted for under
the fair value option (8) 7,878 7,878
Total commercial loans and leases 693 280 730 1,703 386,702 7,878 396,283
Total loans and leases $ 7,405 $ 3,439 $ 28,263 $ 39,107 $ 853,819 $ 25,265 $ 10,042 $ 928,233
Percentage of outstandings 0.80% 0.37% 3.04% 4.21% 91.99% 2.72% 1.08% 100.00%
(1) Home loans 30-59 days past due includes fully-insured loans of $2.5 billion and nonperforming loans of $623 million. Home loans 60-89 days past due includes fully-insured loans of $1.2 billion
and nonperforming loans of $410 million.
(2) Home loans includes fully-insured loans of $17.0 billion.
(3) Home loans includes $5.9 billion and direct/indirect consumer includes $33 million of nonperforming loans.
(4) PCI loan amounts are shown gross of the valuation allowance.
(5) Total outstandings includes pay option loans of $4.4 billion. The Corporation no longer originates this product.
(6) Total outstandings includes dealer financial services loans of $38.5 billion, unsecured consumer lending loans of $2.7 billion, U.S. securities-based lending loans of $31.2 billion, non-U.S. consumer
loans of $4.7 billion, student loans of $4.1 billion and other consumer loans of $1.0 billion.
(7) Total outstandings includes consumer finance loans of $1.2 billion, consumer leases of $606 million, consumer overdrafts of $176 million and other non-U.S. consumer loans of $5 million.
(8) Consumer loans accounted for under the fair value option were residential mortgage loans of $2.0 billion and home equity loans of $147 million. Commercial loans accounted for under the fair value
option were U.S. commercial loans of $1.5 billion and non-U.S. commercial loans of $6.4 billion. For additional information, see Note 20 – Fair Value Measurements and Note 21 – Fair Value Option.
(9) Total outstandings includes U.S. commercial real estate loans of $46.3 billion and non-U.S. commercial real estate loans of $1.6 billion.
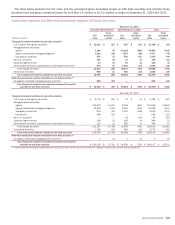
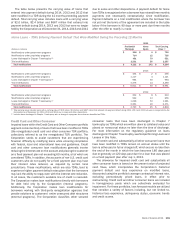
The Corporation has entered into long-term credit protection
agreements with FNMA and FHLMC on loans totaling $17.2 billion
and $28.2 billion at December 31, 2014 and 2013, providing full
credit protection on residential mortgage loans that become
severely delinquent. All of these loans are individually insured and
therefore the Corporation does not record an allowance for credit
losses related to these loans.
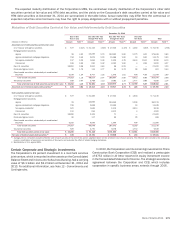
Nonperforming Loans and Leases
The Corporation classifies junior-lien home equity loans as
nonperforming when the first-lien loan becomes 90 days past due
even if the junior-lien loan is performing. At December 31, 2014
and 2013, $800 million and $1.2 billion of such junior-lien home
equity loans were included in nonperforming loans.
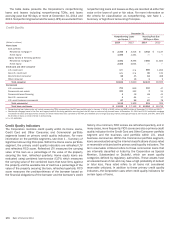
The Corporation classifies consumer real estate loans that
have been discharged in Chapter 7 bankruptcy and not reaffirmed
by the borrower as troubled debt restructurings (TDRs), irrespective
of payment history or delinquency status, even if the repayment
terms for the loan have not been otherwise modified. The
Corporation continues to have a lien on the underlying collateral.
At December 31, 2014, nonperforming loans discharged in
Chapter 7 bankruptcy with no change in repayment terms were
$1.4 billion of which $901 million were current on their contractual
payments, while $395 million were 90 days or more past due. Of
the contractually current nonperforming loans, more than 80
percent were discharged in Chapter 7 bankruptcy more than 12
months ago, and more than 60 percent were discharged 24 months
or more ago. As subsequent cash payments are received on the
loans that are contractually current, the interest component of the
payments is generally recorded as interest income on a cash basis
and the principal component is recorded as a reduction in the
carrying value of the loan.
Excluding purchased credit-impaired (PCI) loans, the
Corporation sold nonperforming and other delinquent consumer
loans with a carrying value, excluding the related allowance, of
$4.8 billion and $2.0 billion, and recognized gains of $247 million
and $58 million recorded in noninterest income, during 2014 and
2013.