Bank of America 2014 Annual Report Download - page 106
Download and view the complete annual report
Please find page 106 of the 2014 Bank of America annual report below. You can navigate through the pages in the report by either clicking on the pages listed below, or by using the keyword search tool below to find specific information within the annual report.-
 1
1 -
2
-
3
-
4
-
5
-
6
-
7
-
8
-
9
-
10
-
11
-
12
-
13
-
14
-
15
-
16
-
17
-
18
-
19
-
20
-
21
-
22
-
23
-
24
-
25
-
26
-
27
-
28
-
29
-
30
-
31
-
32
-
33
-
34
-
35
-
36
-
37
-
38
-
39
-
40
-
41
-
42
-
43
-
44
-
45
-
46
-
47
-
48
-
49
-
50
-
51
-
52
-
53
-
54
-
55
-
56
-
57
-
58
-
59
-
60
-
61
-
62
-
63
-
64
-
65
-
66
-
67
-
68
-
69
-
70
-
71
-
72
-
73
-
74
-
75
-
76
-
77
-
78
-
79
-
80
-
81
-
82
-
83
-
84
-
85
-
86
-
87
-
88
-
89
-
90
-
91
-
92
-
93
-
94
-
95
-
 96
96 -
 97
97 -
 98
98 -
 99
99 -
 100
100 -
 101
101 -
 102
102 -
 103
103 -
 104
104 -
 105
105 -
 106
106 -
 107
107 -
 108
108 -
 109
109 -
 110
110 -
 111
111 -
 112
112 -
 113
113 -
 114
114 -
 115
115 -
 116
116 -
117
-
118
-
119
-
120
-
121
-
122
-
123
-
124
-
125
-
126
-
127
-
128
-
129
-
130
-
131
-
132
-
133
-
134
-
135
-
136
-
137
-
138
-
139
-
140
-
141
-
142
-
143
-
144
-
145
-
146
-
147
-
148
-
149
-
150
-
151
-
152
-
153
-
154
-
155
-
156
-
157
-
158
-
159
-
160
-
161
-
162
-
163
-
164
-
165
-
166
-
167
-
168
-
169
-
170
-
171
-
172
-
173
-
174
-
175
-
176
-
177
-
178
-
179
-
180
-
181
-
182
-
183
-
184
-
185
-
186
-
187
-
188
-
189
-
190
-
191
-
192
-
193
-
194
-
195
-
196
-
197
-
198
-
199
-
200
-
201
-
202
-
203
-
204
-
205
-
206
-
207
-
208
-
209
-
210
-
211
-
212
-
213
-
214
-
215
-
216
-
217
-
218
-
219
-
220
-
221
-
222
-
223
-
224
-
225
-
226
-
227
-
228
-
229
-
230
-
231
-
232
-
233
-
234
-
235
-
236
-
237
-
238
-
239
-
240
-
241
-
242
-
243
-
244
-
245
-
246
-
247
-
248
-
249
-
250
-
251
-
252
-
253
-
254
-
255
-
256
-
257
-
258
-
259
-
260
-
261
-
262
-
263
-
264
-
265
-
266
-
267
-
268
-
269
-
270
-
271
-
272
 |
 |

104 Bank of America 2014
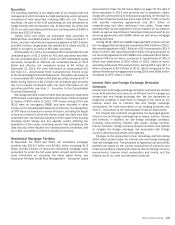
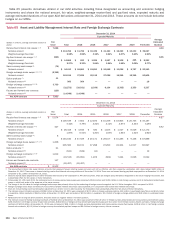
Table 65 presents derivatives utilized in our ALM activities including those designated as accounting and economic hedging
instruments and shows the notional amount, fair value, weighted-average receive-fixed and pay-fixed rates, expected maturity and
average estimated durations of our open ALM derivatives at December 31, 2014 and 2013. These amounts do not include derivative
hedges on our MSRs.
Table 65 Asset and Liability Management Interest Rate and Foreign Exchange Contracts
December 31, 2014
Expected Maturity
(Dollars in millions, average estimated duration in
years)
Fair
Value Total 2015 2016 2017 2018 2019 Thereafter
Average
Estimated
Duration
Receive-fixed interest rate swaps (1, 2) $ 7,626 4.34
Notional amount $ 113,766 $ 11,785 $ 15,339 $ 21,453 $ 15,299 $ 10,233 $ 39,657
Weighted-average fixed-rate 2.98% 3.56% 3.12%3.64%4.07%0.49%2.63%
Pay-fixed interest rate swaps (1, 2) (829) 8.05
Notional amount $ 14,668 $ 520 $ 1,025 $ 1,527 $ 2,908 $ 425 $ 8,263
Weighted-average fixed-rate 2.27% 2.30% 1.65%1.84%1.62%0.09%2.77%
Same-currency basis swaps (3) (74)
Notional amount $ 94,413 $ 18,881 $ 15,691 $ 21,068 $ 11,026 $ 6,787 $ 20,960
Foreign exchange basis swaps (2, 4, 5, 6) (2,352)
Notional amount 161,196 27,629 26,118 27,026 14,255 12,359 53,809
Option products (7) 11
Notional amount (8) 980 964 — — — —16
Foreign exchange contracts (2, 6, 9) 3,700
Notional amount (8) (22,572) (29,931) (2,036) 6,134 (2,335) 2,359 3,237
Futures and forward rate contracts (129)
Notional amount (8) (14,949) (14,949) — — — ——
Net ALM contracts $ 7,953
December 31, 2013
Expected Maturity
(Dollars in millions, average estimated duration in
years)
Fair
Value Total 2014 2015 2016 2017 2018 Thereafter
Average
Estimated
Duration
Receive-fixed interest rate swaps (1, 2) $ 5,074 4.67
Notional amount $109,539 $ 7,604 $ 12,873 $ 15,339 $ 19,803 $ 20,733 $ 33,187
Weighted-average fixed-rate 3.42% 3.79% 3.32% 3.12% 3.87% 3.34% 3.29%
Pay-fixed interest rate swaps (1, 2) 427 5.92
Notional amount $ 28,418 $ 4,645 $ 520 $ 1,025 $ 1,527 $ 8,529 $ 12,172
Weighted-average fixed-rate 1.87% 0.54% 2.30% 1.65% 1.84% 1.52% 2.62%
Same-currency basis swaps (3) 6
Notional amount $145,184 $ 47,529 $ 25,171 $ 28,157 $ 15,283 $ 9,156 $ 19,888
Foreign exchange basis swaps (2, 4, 5, 6) 1,208
Notional amount 205,560 39,151 37,298 27,293 24,304 14,517 62,997
Option products (7) 21
Notional amount (8) (641) (649) (11) — — — 19
Foreign exchange contracts (2, 6, 9) 1,619
Notional amount (8) (19,515) (35,991) 1,873 (669) 7,224 2,026 6,022
Futures and forward rate contracts 147
Notional amount (8) (19,427)(19,427)—————
Net ALM contracts $8,502
(1) The receive-fixed interest rate swap notional amounts that represent forward starting swaps and which will not be effective until their respective contractual start dates totaled $600 million at
December 31, 2013. There were no forward starting receive-fixed interest rate swap positions at December 31, 2014. There were no forward starting pay-fixed swap positions at December 31, 2014
compared to $1.1 billion at December 31, 2013.
(2) Does not include basis adjustments on either fixed-rate debt issued by the Corporation or AFS debt securities, which are hedged using derivatives designated as fair value hedging instruments, that
substantially offset the fair values of these derivatives.
(3) At December 31, 2014 and 2013, the notional amount of same-currency basis swaps was comprised of $94.4 billion and $145.2 billion in both foreign currency and U.S. Dollar-denominated basis
swaps in which both sides of the swap are in the same currency.
(4) The change in the fair value for foreign exchange basis swaps was primarily driven by the weakening of foreign currencies against the U.S. Dollar throughout 2014 compared to 2013.
(5) Foreign exchange basis swaps consisted of cross-currency variable interest rate swaps used separately or in conjunction with receive-fixed interest rate swaps.
(6) Does not include foreign currency translation adjustments on certain non-U.S. debt issued by the Corporation that substantially offset the fair values of these derivatives.
(7) The notional amount of option products of $980 million at December 31, 2014 was comprised of $974 million in foreign exchange options, $16 million in purchased caps/floors and $(10) million
in swaptions. Option products of $(641) million at December 31, 2013 were comprised of $(2.0) billion in swaptions, $1.4 billion in foreign exchange options and $19 million in purchased caps/
floors.
(8) Reflects the net of long and short positions. Amounts shown as negative reflect a net short position.
(9) The notional amount of foreign exchange contracts of $(22.6) billion at December 31, 2014 was comprised of $21.0 billion in foreign currency-denominated and cross-currency receive-fixed swaps,
$(36.4) billion in net foreign currency forward rate contracts, $(8.3) billion in foreign currency-denominated pay-fixed swaps and $1.1 billion in net foreign currency futures contracts. Foreign exchange
contracts of $(19.5) billion at December 31, 2013 were comprised of $36.1 billion in foreign currency-denominated and cross-currency receive-fixed swaps, $(49.3) billion in net foreign currency
forward rate contracts, $(10.3) billion in foreign currency-denominated pay-fixed swaps and $4.0 billion in foreign currency futures contracts.