Bank of America 2014 Annual Report Download - page 126
Download and view the complete annual report
Please find page 126 of the 2014 Bank of America annual report below. You can navigate through the pages in the report by either clicking on the pages listed below, or by using the keyword search tool below to find specific information within the annual report.-
 1
1 -
2
-
3
-
4
-
5
-
6
-
7
-
8
-
9
-
10
-
11
-
12
-
13
-
14
-
15
-
16
-
17
-
18
-
19
-
20
-
21
-
22
-
23
-
24
-
25
-
26
-
27
-
28
-
29
-
30
-
31
-
32
-
33
-
34
-
35
-
36
-
37
-
38
-
39
-
40
-
41
-
42
-
43
-
44
-
45
-
46
-
47
-
48
-
49
-
50
-
51
-
52
-
53
-
54
-
55
-
56
-
57
-
58
-
59
-
60
-
61
-
62
-
63
-
64
-
65
-
66
-
67
-
68
-
69
-
70
-
71
-
72
-
73
-
74
-
75
-
76
-
77
-
78
-
79
-
80
-
81
-
82
-
83
-
84
-
85
-
86
-
87
-
88
-
89
-
90
-
91
-
92
-
93
-
94
-
95
-
96
-
97
-
98
-
99
-
100
-
101
-
102
-
103
-
104
-
105
-
106
-
107
-
108
-
109
-
110
-
111
-
112
-
113
-
114
-
115
-
 116
116 -
 117
117 -
 118
118 -
 119
119 -
 120
120 -
 121
121 -
 122
122 -
 123
123 -
 124
124 -
 125
125 -
 126
126 -
 127
127 -
 128
128 -
 129
129 -
 130
130 -
 131
131 -
 132
132 -
 133
133 -
 134
134 -
 135
135 -
 136
136 -
137
-
138
-
139
-
140
-
141
-
142
-
143
-
144
-
145
-
146
-
147
-
148
-
149
-
150
-
151
-
152
-
153
-
154
-
155
-
156
-
157
-
158
-
159
-
160
-
161
-
162
-
163
-
164
-
165
-
166
-
167
-
168
-
169
-
170
-
171
-
172
-
173
-
174
-
175
-
176
-
177
-
178
-
179
-
180
-
181
-
182
-
183
-
184
-
185
-
186
-
187
-
188
-
189
-
190
-
191
-
192
-
193
-
194
-
195
-
196
-
197
-
198
-
199
-
200
-
201
-
202
-
203
-
204
-
205
-
206
-
207
-
208
-
209
-
210
-
211
-
212
-
213
-
214
-
215
-
216
-
217
-
218
-
219
-
220
-
221
-
222
-
223
-
224
-
225
-
226
-
227
-
228
-
229
-
230
-
231
-
232
-
233
-
234
-
235
-
236
-
237
-
238
-
239
-
240
-
241
-
242
-
243
-
244
-
245
-
246
-
247
-
248
-
249
-
250
-
251
-
252
-
253
-
254
-
255
-
256
-
257
-
258
-
259
-
260
-
261
-
262
-
263
-
264
-
265
-
266
-
267
-
268
-
269
-
270
-
271
-
272
 |
 |

124 Bank of America 2014
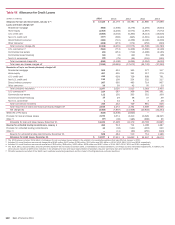
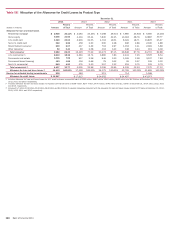
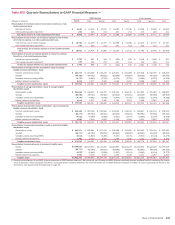
Table VIII Allocation of the Allowance for Credit Losses by Product Type
December 31
2014 2013 2012 2011 2010
(Dollars in millions) Amount
Percent
of Total Amount
Percent
of Total Amount
Percent
of Total Amount
Percent
of Total Amount
Percent
of Total
Allowance for loan and lease losses
Residential mortgage $ 2,900 20.11% $ 4,084 23.43% $ 7,088 29.31% $ 7,985 23.64% $ 6,365 15.20%
Home equity 3,035 21.05 4,434 25.44 7,845 32.45 13,094 38.76 12,887 30.77
U.S. credit card 3,320 23.03 3,930 22.55 4,718 19.51 6,322 18.71 10,876 25.97
Non-U.S. credit card 369 2.56 459 2.63 600 2.48 946 2.80 2,045 4.88
Direct/Indirect consumer 299 2.07 417 2.39 718 2.97 1,153 3.41 2,381 5.68
Other consumer 59 0.41 99 0.58 104 0.43 148 0.44 161 0.38
Total consumer 9,982 69.23 13,423 77.02 21,073 87.15 29,648 87.76 34,715 82.88
U.S. commercial (1) 2,619 18.16 2,394 13.74 1,885 7.80 2,441 7.23 3,576 8.54
Commercial real estate 1,016 7.05 917 5.26 846 3.50 1,349 3.99 3,137 7.49
Commercial lease financing 153 1.06 118 0.68 78 0.32 92 0.27 126 0.30
Non-U.S. commercial 649 4.50 576 3.30 297 1.23 253 0.75 331 0.79
Total commercial (2) 4,437 30.77 4,005 22.98 3,106 12.85 4,135 12.24 7,170 17.12
Allowance for loan and lease losses (3) 14,419 100.00% 17,428 100.00% 24,179 100.00% 33,783 100.00% 41,885 100.00%
Reserve for unfunded lending commitments 528 484 513 714 1,188
Allowance for credit losses $ 14,947 $ 17,912 $ 24,692 $ 34,497 $ 43,073
(1) Includes allowance for loan and lease losses for U.S. small business commercial loans of $536 million, $462 million, $642 million, $893 million and $1.5 billion at December 31, 2014, 2013,
2012, 2011 and 2010, respectively.
(2) Includes allowance for loan and lease losses for impaired commercial loans of $159 million, $277 million, $475 million, $545 million and $1.1 billion at December 31, 2014, 2013, 2012, 2011
and 2010, respectively.
(3) Includes $1.7 billion, $2.5 billion, $5.5 billion, $8.5 billion and $6.4 billion of valuation allowance presented with the allowance for loan and lease losses related to PCI loans at December 31, 2014,
2013, 2012, 2011 and 2010, respectively.