Bank of America 2014 Annual Report Download - page 127
Download and view the complete annual report
Please find page 127 of the 2014 Bank of America annual report below. You can navigate through the pages in the report by either clicking on the pages listed below, or by using the keyword search tool below to find specific information within the annual report.-
 1
1 -
2
-
3
-
4
-
5
-
6
-
7
-
8
-
9
-
10
-
11
-
12
-
13
-
14
-
15
-
16
-
17
-
18
-
19
-
20
-
21
-
22
-
23
-
24
-
25
-
26
-
27
-
28
-
29
-
30
-
31
-
32
-
33
-
34
-
35
-
36
-
37
-
38
-
39
-
40
-
41
-
42
-
43
-
44
-
45
-
46
-
47
-
48
-
49
-
50
-
51
-
52
-
53
-
54
-
55
-
56
-
57
-
58
-
59
-
60
-
61
-
62
-
63
-
64
-
65
-
66
-
67
-
68
-
69
-
70
-
71
-
72
-
73
-
74
-
75
-
76
-
77
-
78
-
79
-
80
-
81
-
82
-
83
-
84
-
85
-
86
-
87
-
88
-
89
-
90
-
91
-
92
-
93
-
94
-
95
-
96
-
97
-
98
-
99
-
100
-
101
-
102
-
103
-
104
-
105
-
106
-
107
-
108
-
109
-
110
-
111
-
112
-
113
-
114
-
115
-
116
-
 117
117 -
 118
118 -
 119
119 -
 120
120 -
 121
121 -
 122
122 -
 123
123 -
 124
124 -
 125
125 -
 126
126 -
 127
127 -
 128
128 -
 129
129 -
 130
130 -
 131
131 -
 132
132 -
 133
133 -
 134
134 -
 135
135 -
 136
136 -
 137
137 -
138
-
139
-
140
-
141
-
142
-
143
-
144
-
145
-
146
-
147
-
148
-
149
-
150
-
151
-
152
-
153
-
154
-
155
-
156
-
157
-
158
-
159
-
160
-
161
-
162
-
163
-
164
-
165
-
166
-
167
-
168
-
169
-
170
-
171
-
172
-
173
-
174
-
175
-
176
-
177
-
178
-
179
-
180
-
181
-
182
-
183
-
184
-
185
-
186
-
187
-
188
-
189
-
190
-
191
-
192
-
193
-
194
-
195
-
196
-
197
-
198
-
199
-
200
-
201
-
202
-
203
-
204
-
205
-
206
-
207
-
208
-
209
-
210
-
211
-
212
-
213
-
214
-
215
-
216
-
217
-
218
-
219
-
220
-
221
-
222
-
223
-
224
-
225
-
226
-
227
-
228
-
229
-
230
-
231
-
232
-
233
-
234
-
235
-
236
-
237
-
238
-
239
-
240
-
241
-
242
-
243
-
244
-
245
-
246
-
247
-
248
-
249
-
250
-
251
-
252
-
253
-
254
-
255
-
256
-
257
-
258
-
259
-
260
-
261
-
262
-
263
-
264
-
265
-
266
-
267
-
268
-
269
-
270
-
271
-
272
 |
 |

Bank of America 2014 125
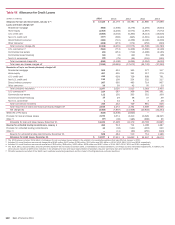
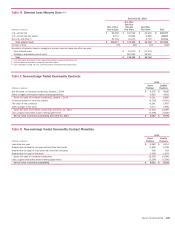
Table IX Selected Loan Maturity Data (1, 2)
December 31, 2014
(Dollars in millions)
Due in One
Year or Less
Due After
One Year
Through
Five Years
Due After
Five Years Total
U.S. commercial $ 66,039 $ 126,522 $ 42,916 $ 235,477
U.S. commercial real estate 8,714 31,825 4,648 45,187
Non-U.S. and other (3) 61,524 21,015 4,752 87,291
Total selected loans $ 136,277 $ 179,362 $ 52,316 $ 367,955
Percent of total 37% 49% 14% 100%
Sensitivity of selected loans to changes in interest rates for loans due after one year:
Fixed interest rates $ 14,070 $ 27,379
Floating or adjustable interest rates 165,292 24,937
Total $ 179,362 $ 52,316
(1) Loan maturities are based on the remaining maturities under contractual terms.
(2) Includes loans accounted for under the fair value option.
(3) Loan maturities include non-U.S. commercial and commercial real estate loans.
Table X Non-exchange Traded Commodity Contracts
2014
(Dollars in millions)
Asset
Positions
Liability
Positions
Net fair value of contracts outstanding, January 1, 2014 $ 4,376 $ 4,240
Effect of legally enforceable master netting agreements 4,625 4,625
Gross fair value of contracts outstanding, January 1, 2014 9,001 8,865
Contracts realized or otherwise settled (4,738) (4,581)
Fair value of new contracts 8,281 7,833
Other changes in fair value 1,014 1,982
Gross fair value of contracts outstanding, December 31, 2014 13,558 14,099
Less: Legally enforceable master netting agreements (5,506) (5,506)
Net fair value of contracts outstanding, December 31, 2014 $ 8,052 $ 8,593
Table XI Non-exchange Traded Commodity Contract Maturities
2014
(Dollars in millions)
Asset
Positions
Liability
Positions
Less than one year $ 8,262 $ 9,114
Greater than or equal to one year and less than three years 2,598 2,798
Greater than or equal to three years and less than five years 599 533
Greater than or equal to five years 2,099 1,654
Gross fair value of contracts outstanding 13,558 14,099
Less: Legally enforceable master netting agreements (5,506) (5,506)
Net fair value of contracts outstanding $ 8,052 $ 8,593