Bank of America 2014 Annual Report Download - page 73
Download and view the complete annual report
Please find page 73 of the 2014 Bank of America annual report below. You can navigate through the pages in the report by either clicking on the pages listed below, or by using the keyword search tool below to find specific information within the annual report.-
 1
1 -
2
-
3
-
4
-
5
-
6
-
7
-
8
-
9
-
10
-
11
-
12
-
13
-
14
-
15
-
16
-
17
-
18
-
19
-
20
-
21
-
22
-
23
-
24
-
25
-
26
-
27
-
28
-
29
-
30
-
31
-
32
-
33
-
34
-
35
-
36
-
37
-
38
-
39
-
40
-
41
-
42
-
43
-
44
-
45
-
46
-
47
-
48
-
49
-
50
-
51
-
52
-
53
-
54
-
55
-
56
-
57
-
58
-
59
-
60
-
61
-
62
-
 63
63 -
 64
64 -
 65
65 -
 66
66 -
 67
67 -
 68
68 -
 69
69 -
 70
70 -
 71
71 -
 72
72 -
 73
73 -
 74
74 -
 75
75 -
 76
76 -
 77
77 -
 78
78 -
 79
79 -
 80
80 -
 81
81 -
 82
82 -
 83
83 -
84
-
85
-
86
-
87
-
88
-
89
-
90
-
91
-
92
-
93
-
94
-
95
-
96
-
97
-
98
-
99
-
100
-
101
-
102
-
103
-
104
-
105
-
106
-
107
-
108
-
109
-
110
-
111
-
112
-
113
-
114
-
115
-
116
-
117
-
118
-
119
-
120
-
121
-
122
-
123
-
124
-
125
-
126
-
127
-
128
-
129
-
130
-
131
-
132
-
133
-
134
-
135
-
136
-
137
-
138
-
139
-
140
-
141
-
142
-
143
-
144
-
145
-
146
-
147
-
148
-
149
-
150
-
151
-
152
-
153
-
154
-
155
-
156
-
157
-
158
-
159
-
160
-
161
-
162
-
163
-
164
-
165
-
166
-
167
-
168
-
169
-
170
-
171
-
172
-
173
-
174
-
175
-
176
-
177
-
178
-
179
-
180
-
181
-
182
-
183
-
184
-
185
-
186
-
187
-
188
-
189
-
190
-
191
-
192
-
193
-
194
-
195
-
196
-
197
-
198
-
199
-
200
-
201
-
202
-
203
-
204
-
205
-
206
-
207
-
208
-
209
-
210
-
211
-
212
-
213
-
214
-
215
-
216
-
217
-
218
-
219
-
220
-
221
-
222
-
223
-
224
-
225
-
226
-
227
-
228
-
229
-
230
-
231
-
232
-
233
-
234
-
235
-
236
-
237
-
238
-
239
-
240
-
241
-
242
-
243
-
244
-
245
-
246
-
247
-
248
-
249
-
250
-
251
-
252
-
253
-
254
-
255
-
256
-
257
-
258
-
259
-
260
-
261
-
262
-
263
-
264
-
265
-
266
-
267
-
268
-
269
-
270
-
271
-
272
 |
 |

Bank of America 2014 71
$59.0 billion had FHA insurance with the remainder protected by
long-term standby agreements. At December 31, 2014 and 2013,
$15.9 billion and $22.5 billion of the FHA-insured loan population
were repurchases of delinquent FHA loans pursuant to our
servicing agreements with GNMA. All of these loans are individually
insured and therefore the Corporation does not record a significant
allowance for loan and lease losses with respect to these loans.
The long-term standby agreements with FNMA and FHLMC
reduce our regulatory risk-weighted assets due to the transfer of
a portion of our credit risk to unaffiliated parties. At December 31,
2014, these programs had the cumulative effect of reducing our
risk-weighted assets by $5.2 billion, increasing both our Tier 1
capital ratio and Common equity tier 1 capital ratio by five bps
under the Basel 3 Standardized – Transition. This compared to
reducing our risk-weighted assets by $8.4 billion, increasing our
Tier 1 capital ratio by eight bps and increasing our Tier 1 common
capital ratio by seven bps at December 31, 2013 under Basel 1
(which included the Market Risk Final Rules).
In addition to the long-term standby agreements with FNMA
and FHLMC, we have mitigated a portion of our credit risk on the
residential mortgage portfolio through the use of synthetic
securitization vehicles. These vehicles issue long-term notes to
investors, the proceeds of which are held as cash collateral. We
pay a premium to the vehicles to purchase mezzanine loss
protection on a portfolio of residential mortgage loans HFI. Cash
held in the vehicles is used to reimburse us in the event that losses
on the mortgage portfolio exceed 10 bps of the original pool
balance, up to the remaining amount of purchased loss protection
of $270 million and $339 million at December 31, 2014 and 2013.
Amounts due from the vehicles are recorded in other income (loss)
in the Consolidated Statement of Income when we recognize a
reimbursable loss. Amounts are collected when reimbursable
losses are realized through the sale of the underlying collateral.
At December 31, 2014 and 2013, the synthetic securitization
vehicles referenced principal balances of $7.0 billion and $12.5
billion of residential mortgage loans and we had a receivable of
$146 million and $198 million from these vehicles for
reimbursement of losses. We record an allowance for loan and
lease losses on loans referenced by the synthetic securitization
vehicles without regard to the existence of the purchased loss
protection as the protection does not represent a guarantee of
individual loans. The reported net charge-offs for the residential
mortgage portfolio do not include the benefit of amounts
reimbursable from these vehicles.
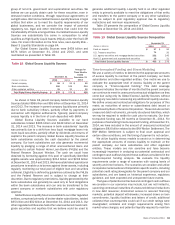
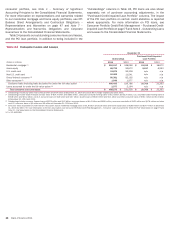
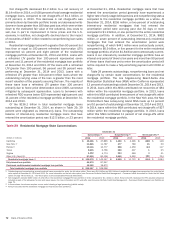
Table 28 presents certain residential mortgage key credit
statistics on both a reported basis excluding loans accounted for
under the fair value option, and excluding the PCI loan portfolio,
our fully-insured loan portfolio and loans accounted for under the
fair value option. Additionally, in the “Reported Basis” columns in
the table below, accruing balances past due and nonperforming
loans do not include the PCI loan portfolio, in accordance with our
accounting policies, even though the customer may be
contractually past due. As such, the following discussion presents
the residential mortgage portfolio excluding the PCI loan portfolio,
the fully-insured loan portfolio and loans accounted for under the
fair value option. For more information on the PCI loan portfolio,
see page 75.
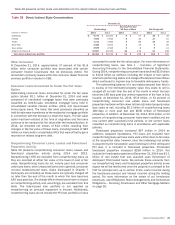
Table 28 Residential Mortgage – Key Credit Statistics
December 31
Reported Basis (1)
Excluding Purchased
Credit-impaired and
Fully-insured Loans
(Dollars in millions) 2014 2013 2014 2013
Outstandings $ 216,197 $ 248,066 $ 136,075 $ 142,147
Accruing past due 30 days or more 16,485 23,052 1,868 2,371
Accruing past due 90 days or more 11,407 16,961 ——
Nonperforming loans 6,889 11,712 6,889 11,712
Percent of portfolio
Refreshed LTV greater than 90 but less than or equal to 100 (2) 9% 11% 6% 8%
Refreshed LTV greater than 100 (2) 12 17 711
Refreshed FICO below 620 16 20 811
2006 and 2007 vintages (3) 19 21 22 27
Net charge-off ratio (4) (0.05) 0.42 (0.08) 0.74
(1) Outstandings, accruing past due, nonperforming loans and percentages of portfolio exclude loans accounted for under the fair value option. There were $1.9 billion and $2.0 billion of residential
mortgage loans accounted for under the fair value option at December 31, 2014 and 2013. For more information on the fair value option, see Consumer Portfolio Credit Risk Management – Consumer
Loans Accounted for Under the Fair Value Option on page 79 and Note 21 – Fair Value Option to the Consolidated Financial Statements.
(2) Effective December 31, 2014, with the exception of high-value properties, underlying values for LTV ratios are primarily determined using automated valuation models. For high-value properties,
generally with an original value of $1 million or more, estimated property values are determined using the CoreLogic Case-Shiller Index. Prior-period values have been updated to reflect this change.
Previously reported values were primarily determined through an index-based approach.
(3) These vintages of loans account for $2.8 billion, or 41 percent, and $6.2 billion, or 53 percent, of nonperforming residential mortgage loans at December 31, 2014 and 2013. Additionally, these
vintages contributed net recoveries of $233 million to residential mortgage net recoveries in 2014 and $653 million, or 60 percent, of total residential mortgage net charge-offs in 2013.
(4) Net charge-off ratios are calculated as net charge-offs divided by average outstanding loans excluding loans accounted for under the fair value option.
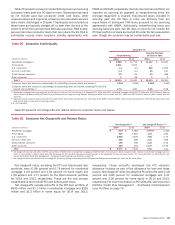
Nonperforming residential mortgage loans decreased $4.8
billion in 2014 as sales of $4.1 billion, paydowns, returns to
performing status, charge-offs, and transfers to foreclosed
properties and held-for-sale outpaced new inflows. Of the
nonperforming residential mortgage loans at December 31, 2014,
$1.8 billion, or 26 percent were current on contractual payments.
Nonperforming loans that are contractually current primarily
consist of collateral-dependent TDRs, including those that have
been discharged in Chapter 7 bankruptcy, as well as loans that
have not yet demonstrated a sustained period of payment
performance. In addition, $3.8 billion, or 55 percent of
nonperforming residential mortgage loans were 180 days or more
past due and had been written down to the estimated fair value
of the collateral, less costs to sell. Accruing loans past due 30
days or more decreased $503 million in 2014.