Bank of America 2014 Annual Report Download - page 190
Download and view the complete annual report
Please find page 190 of the 2014 Bank of America annual report below. You can navigate through the pages in the report by either clicking on the pages listed below, or by using the keyword search tool below to find specific information within the annual report.-
 1
1 -
2
-
3
-
4
-
5
-
6
-
7
-
8
-
9
-
10
-
11
-
12
-
13
-
14
-
15
-
16
-
17
-
18
-
19
-
20
-
21
-
22
-
23
-
24
-
25
-
26
-
27
-
28
-
29
-
30
-
31
-
32
-
33
-
34
-
35
-
36
-
37
-
38
-
39
-
40
-
41
-
42
-
43
-
44
-
45
-
46
-
47
-
48
-
49
-
50
-
51
-
52
-
53
-
54
-
55
-
56
-
57
-
58
-
59
-
60
-
61
-
62
-
63
-
64
-
65
-
66
-
67
-
68
-
69
-
70
-
71
-
72
-
73
-
74
-
75
-
76
-
77
-
78
-
79
-
80
-
81
-
82
-
83
-
84
-
85
-
86
-
87
-
88
-
89
-
90
-
91
-
92
-
93
-
94
-
95
-
96
-
97
-
98
-
99
-
100
-
101
-
102
-
103
-
104
-
105
-
106
-
107
-
108
-
109
-
110
-
111
-
112
-
113
-
114
-
115
-
116
-
117
-
118
-
119
-
120
-
121
-
122
-
123
-
124
-
125
-
126
-
127
-
128
-
129
-
130
-
131
-
132
-
133
-
134
-
135
-
136
-
137
-
138
-
139
-
140
-
141
-
142
-
143
-
144
-
145
-
146
-
147
-
148
-
149
-
150
-
151
-
152
-
153
-
154
-
155
-
156
-
157
-
158
-
159
-
160
-
161
-
162
-
163
-
164
-
165
-
166
-
167
-
168
-
169
-
170
-
171
-
172
-
173
-
174
-
175
-
176
-
177
-
178
-
179
-
 180
180 -
 181
181 -
 182
182 -
 183
183 -
 184
184 -
 185
185 -
 186
186 -
 187
187 -
 188
188 -
 189
189 -
 190
190 -
 191
191 -
 192
192 -
 193
193 -
 194
194 -
 195
195 -
 196
196 -
 197
197 -
 198
198 -
 199
199 -
 200
200 -
201
-
202
-
203
-
204
-
205
-
206
-
207
-
208
-
209
-
210
-
211
-
212
-
213
-
214
-
215
-
216
-
217
-
218
-
219
-
220
-
221
-
222
-
223
-
224
-
225
-
226
-
227
-
228
-
229
-
230
-
231
-
232
-
233
-
234
-
235
-
236
-
237
-
238
-
239
-
240
-
241
-
242
-
243
-
244
-
245
-
246
-
247
-
248
-
249
-
250
-
251
-
252
-
253
-
254
-
255
-
256
-
257
-
258
-
259
-
260
-
261
-
262
-
263
-
264
-
265
-
266
-
267
-
268
-
269
-
270
-
271
-
272
 |
 |

188 Bank of America 2014
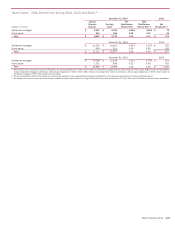
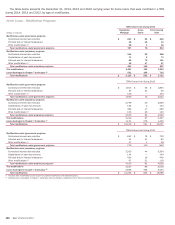
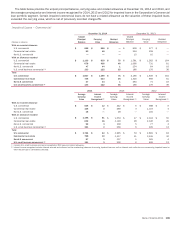
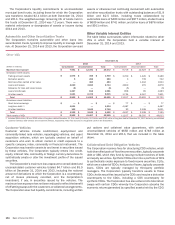
The table below presents the allowance and the carrying value of outstanding loans and leases by portfolio segment at December
31, 2014 and 2013.
Allowance and Carrying Value by Portfolio Segment
December 31, 2014
(Dollars in millions)
Home
Loans
Credit Card
and Other
Consumer Commercial Total
Impaired loans and troubled debt restructurings (1)
Allowance for loan and lease losses (2) $727 $339 $159 $ 1,225
Carrying value (3) 25,628 1,141 2,198 28,967
Allowance as a percentage of carrying value 2.84% 29.71% 7.23%4.23%
Loans collectively evaluated for impairment
Allowance for loan and lease losses $ 3,556 $ 3,708 $ 4,278 $ 11,542
Carrying value (3, 4) 255,525 183,430 384,019 822,974
Allowance as a percentage of carrying value (4) 1.39%2.02%1.11%1.40%
Purchased credit-impaired loans
Valuation allowance $ 1,652 n/a n/a $ 1,652
Carrying value gross of valuation allowance 20,769 n/a n/a 20,769
Valuation allowance as a percentage of carrying value 7.95% n/a n/a 7.95%
Total
Allowance for loan and lease losses $ 5,935 $ 4,047 $ 4,437 $ 14,419
Carrying value (3, 4) 301,922 184,571 386,217 872,710
Allowance as a percentage of carrying value (4) 1.97%2.19%1.15%1.65%
December 31, 2013
Impaired loans and troubled debt restructurings (1)
Allowance for loan and lease losses (2) $ 1,231 $ 579 $ 277 $ 2,087
Carrying value (3) 31,458 2,079 3,048 36,585
Allowance as a percentage of carrying value 3.91% 27.85% 9.09% 5.70%
Loans collectively evaluated for impairment
Allowance for loan and lease losses $ 4,794 $ 4,326 $ 3,728 $ 12,848
Carrying value (3, 4) 285,015 185,969 385,357 856,341
Allowance as a percentage of carrying value (4) 1.68% 2.33% 0.97% 1.50%
Purchased credit-impaired loans
Valuation allowance $ 2,493 n/a n/a $ 2,493
Carrying value gross of valuation allowance 25,265 n/a n/a 25,265
Valuation allowance as a percentage of carrying value 9.87% n/a n/a 9.87%
Total
Allowance for loan and lease losses $ 8,518 $ 4,905 $ 4,005 $ 17,428
Carrying value (3, 4) 341,738 188,048 388,405 918,191
Allowance as a percentage of carrying value (4) 2.49% 2.61% 1.03% 1.90%
(1) Impaired loans include nonperforming commercial loans and all TDRs, including both commercial and consumer TDRs. Impaired loans exclude nonperforming consumer loans unless they are TDRs,
and all consumer and commercial loans accounted for under the fair value option.
(2) Allowance for loan and lease losses includes $35 million and $36 million related to impaired U.S. small business commercial at December 31, 2014 and 2013.
(3) Amounts are presented gross of the allowance for loan and lease losses.
(4) Outstanding loan and lease balances and ratios do not include loans accounted for under the fair value option of $8.7 billion and $10.0 billion at December 31, 2014 and 2013.
n/a = not applicable