Bank of America 2014 Annual Report Download - page 102
Download and view the complete annual report
Please find page 102 of the 2014 Bank of America annual report below. You can navigate through the pages in the report by either clicking on the pages listed below, or by using the keyword search tool below to find specific information within the annual report.-
 1
1 -
2
-
3
-
4
-
5
-
6
-
7
-
8
-
9
-
10
-
11
-
12
-
13
-
14
-
15
-
16
-
17
-
18
-
19
-
20
-
21
-
22
-
23
-
24
-
25
-
26
-
27
-
28
-
29
-
30
-
31
-
32
-
33
-
34
-
35
-
36
-
37
-
38
-
39
-
40
-
41
-
42
-
43
-
44
-
45
-
46
-
47
-
48
-
49
-
50
-
51
-
52
-
53
-
54
-
55
-
56
-
57
-
58
-
59
-
60
-
61
-
62
-
63
-
64
-
65
-
66
-
67
-
68
-
69
-
70
-
71
-
72
-
73
-
74
-
75
-
76
-
77
-
78
-
79
-
80
-
81
-
82
-
83
-
84
-
85
-
86
-
87
-
88
-
89
-
90
-
91
-
 92
92 -
 93
93 -
 94
94 -
 95
95 -
 96
96 -
 97
97 -
 98
98 -
 99
99 -
 100
100 -
 101
101 -
 102
102 -
 103
103 -
 104
104 -
 105
105 -
 106
106 -
 107
107 -
 108
108 -
 109
109 -
 110
110 -
 111
111 -
 112
112 -
113
-
114
-
115
-
116
-
117
-
118
-
119
-
120
-
121
-
122
-
123
-
124
-
125
-
126
-
127
-
128
-
129
-
130
-
131
-
132
-
133
-
134
-
135
-
136
-
137
-
138
-
139
-
140
-
141
-
142
-
143
-
144
-
145
-
146
-
147
-
148
-
149
-
150
-
151
-
152
-
153
-
154
-
155
-
156
-
157
-
158
-
159
-
160
-
161
-
162
-
163
-
164
-
165
-
166
-
167
-
168
-
169
-
170
-
171
-
172
-
173
-
174
-
175
-
176
-
177
-
178
-
179
-
180
-
181
-
182
-
183
-
184
-
185
-
186
-
187
-
188
-
189
-
190
-
191
-
192
-
193
-
194
-
195
-
196
-
197
-
198
-
199
-
200
-
201
-
202
-
203
-
204
-
205
-
206
-
207
-
208
-
209
-
210
-
211
-
212
-
213
-
214
-
215
-
216
-
217
-
218
-
219
-
220
-
221
-
222
-
223
-
224
-
225
-
226
-
227
-
228
-
229
-
230
-
231
-
232
-
233
-
234
-
235
-
236
-
237
-
238
-
239
-
240
-
241
-
242
-
243
-
244
-
245
-
246
-
247
-
248
-
249
-
250
-
251
-
252
-
253
-
254
-
255
-
256
-
257
-
258
-
259
-
260
-
261
-
262
-
263
-
264
-
265
-
266
-
267
-
268
-
269
-
270
-
271
-
272
 |
 |

100 Bank of America 2014
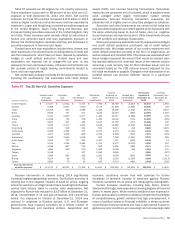
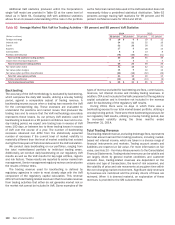
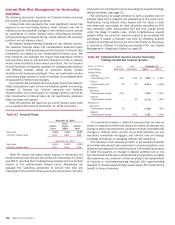
Additional VaR statistics produced within the Corporation’s
single VaR model are provided in Table 62 at the same level of
detail as in Table 61. Evaluating VaR with additional statistics
allows for an increased understanding of the risks in the portfolio
as the historical market data used in the VaR calculation does not
necessarily follow a predefined statistical distribution. Table 62
presents average trading VaR statistics for 99 percent and 95
percent confidence levels for 2014 and 2013.
Table 62 Average Market Risk VaR for Trading Activities – 99 percent and 95 percent VaR Statistics
2014 2013
(Dollars in millions) 99 percent 95 percent 99 percent 95 percent
Foreign exchange $16$ 9
$19$ 12
Interest rate 34 21 32 19
Credit 52 26 58 33
Equities 17 9 28 15
Commodities 84
13 8
Portfolio diversification (78) (43) (85) (51)
Total covered positions trading portfolio 49 26 65 36
Impact from less liquid exposures 7343
Total market-based trading portfolio 56 29 69 39
Fair value option loans 31 15 42 21
Fair value option hedges 14 9 19 13
Fair value option portfolio diversification (24) (14) (32) (19)
Total fair value option portfolio 21 10 29 15
Portfolio diversification (12) (8)(13) (9)
Total market-based portfolio $65$31 $85$ 45
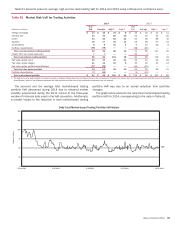
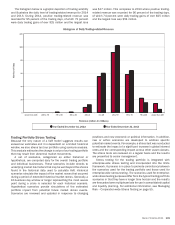
Backtesting
The accuracy of the VaR methodology is evaluated by backtesting,
which compares the daily VaR results, utilizing a one-day holding
period, against a comparable subset of trading revenue. A
backtesting excess occurs when a trading loss exceeds the VaR
for the corresponding day. These excesses are evaluated to
understand the positions and market moves that produced the
trading loss and to ensure that the VaR methodology accurately
represents those losses. As our primary VaR statistic used for
backtesting is based on a 99 percent confidence level and a one-
day holding period, we expect one trading loss in excess of VaR
every 100 days, or between two to three trading losses in excess
of VaR over the course of a year. The number of backtesting
excesses observed can differ from the statistically expected
number of excesses if the current level of market volatility is
materially different than the level of market volatility that existed
during the three years of historical data used in the VaR calculation.
We conduct daily backtesting on our portfolios, ranging from
the total market-based portfolio to individual trading areas.
Additionally, we conduct daily backtesting on our regulatory VaR
results as well as the VaR results for key legal entities, regions
and risk factors. These results are reported to senior market risk
management. Senior management regularly reviews and evaluates
the results of these tests.
The trading revenue used for backtesting is defined by
regulatory agencies in order to most closely align with the VaR
component of the regulatory capital calculation. This revenue
differs from total trading-related revenue in that it excludes revenue
from trading activities that either do not generate market risk or
the market risk cannot be included in VaR. Some examples of the
types of revenue excluded for backtesting are fees, commissions,
reserves, net interest income and intraday trading revenues. In
addition, CVA is not included in the VaR component of the regulatory
capital calculation and is therefore not included in the revenue
used for backtesting of the regulatory VaR results.
During 2014, there were no days in which there was a
backtesting excess for our total market-based portfolio, utilizing a
one-day holding period. There were three backtesting excesses for
our regulatory VaR results, utilizing a one-day holding period, due
to increased volatility during the three months ended
December 31, 2014.
Total Trading Revenue
Total trading-related revenue, excluding brokerage fees, represents
the total amount earned from trading positions, including market-
based net interest income, which are taken in a diverse range of
financial instruments and markets. Trading account assets and
liabilities are reported at fair value. For more information on fair
value, see Note 20 – Fair Value Measurements to the Consolidated
Financial Statements. Trading-related revenues can be volatile and
are largely driven by general market conditions and customer
demand. Also, trading-related revenues are dependent on the
volume and type of transactions, the level of risk assumed, and
the volatility of price and rate movements at any given time within
the ever-changing market environment. Significant daily revenues
by business are monitored and the primary drivers of these are
reviewed. When it is deemed material, an explanation of these
revenues is provided to the GM subcommittee.