Bank of America 2014 Annual Report Download - page 231
Download and view the complete annual report
Please find page 231 of the 2014 Bank of America annual report below. You can navigate through the pages in the report by either clicking on the pages listed below, or by using the keyword search tool below to find specific information within the annual report.-
 1
1 -
2
-
3
-
4
-
5
-
6
-
7
-
8
-
9
-
10
-
11
-
12
-
13
-
14
-
15
-
16
-
17
-
18
-
19
-
20
-
21
-
22
-
23
-
24
-
25
-
26
-
27
-
28
-
29
-
30
-
31
-
32
-
33
-
34
-
35
-
36
-
37
-
38
-
39
-
40
-
41
-
42
-
43
-
44
-
45
-
46
-
47
-
48
-
49
-
50
-
51
-
52
-
53
-
54
-
55
-
56
-
57
-
58
-
59
-
60
-
61
-
62
-
63
-
64
-
65
-
66
-
67
-
68
-
69
-
70
-
71
-
72
-
73
-
74
-
75
-
76
-
77
-
78
-
79
-
80
-
81
-
82
-
83
-
84
-
85
-
86
-
87
-
88
-
89
-
90
-
91
-
92
-
93
-
94
-
95
-
96
-
97
-
98
-
99
-
100
-
101
-
102
-
103
-
104
-
105
-
106
-
107
-
108
-
109
-
110
-
111
-
112
-
113
-
114
-
115
-
116
-
117
-
118
-
119
-
120
-
121
-
122
-
123
-
124
-
125
-
126
-
127
-
128
-
129
-
130
-
131
-
132
-
133
-
134
-
135
-
136
-
137
-
138
-
139
-
140
-
141
-
142
-
143
-
144
-
145
-
146
-
147
-
148
-
149
-
150
-
151
-
152
-
153
-
154
-
155
-
156
-
157
-
158
-
159
-
160
-
161
-
162
-
163
-
164
-
165
-
166
-
167
-
168
-
169
-
170
-
171
-
172
-
173
-
174
-
175
-
176
-
177
-
178
-
179
-
180
-
181
-
182
-
183
-
184
-
185
-
186
-
187
-
188
-
189
-
190
-
191
-
192
-
193
-
194
-
195
-
196
-
197
-
198
-
199
-
200
-
201
-
202
-
203
-
204
-
205
-
206
-
207
-
208
-
209
-
210
-
211
-
212
-
213
-
214
-
215
-
216
-
217
-
218
-
219
-
220
-
 221
221 -
 222
222 -
 223
223 -
 224
224 -
 225
225 -
 226
226 -
 227
227 -
 228
228 -
 229
229 -
 230
230 -
 231
231 -
 232
232 -
 233
233 -
 234
234 -
 235
235 -
 236
236 -
 237
237 -
 238
238 -
 239
239 -
 240
240 -
 241
241 -
242
-
243
-
244
-
245
-
246
-
247
-
248
-
249
-
250
-
251
-
252
-
253
-
254
-
255
-
256
-
257
-
258
-
259
-
260
-
261
-
262
-
263
-
264
-
265
-
266
-
267
-
268
-
269
-
270
-
271
-
272
 |
 |

Bank of America 2014 229
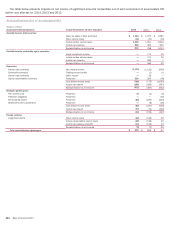
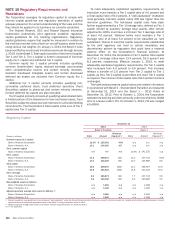
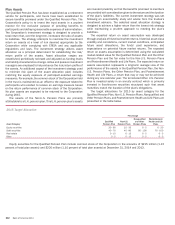
experience of the participants in the Corporation’s U.S. plans. The
adoption of the new mortality assumptions resulted in an increase
to the PBO of approximately $580 million at December 31, 2014.
The discount rate assumptions are derived from a cash flow
matching technique that utilizes rates that are based on Aa-rated
corporate bonds with cash flows that match estimated benefit
payments of each of the plans. The decrease in weighted-average
discount rates in 2014 resulted in an increase to the PBO of
approximately $1.9 billion at December 31, 2014.
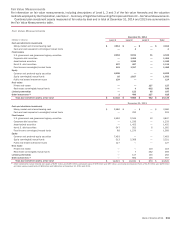
The Corporation’s best estimate of its contributions to be made
to the Non-U.S. Pension Plans, Nonqualified and Other Pension
Plans, and Postretirement Health and Life Plans in 2015 is $56
million, $101 million and $87 million, respectively. The Corporation
does not expect to make a contribution to the Qualified Pension
Plan in 2015.
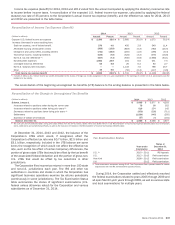
Pension and Postretirement Plans
Qualified
Pension Plan (1)
Non-U.S.
Pension Plans (1)
Nonqualified
and Other
Pension Plans (1)
Postretirement
Health and Life
Plans (1)
(Dollars in millions) 2014 2013 2014 2013 2014 2013 2014 2013
Change in fair value of plan assets
Fair value, January 1 $ 18,276 $ 16,274 $ 2,457 $ 2,306 $ 2,720 $ 3,063 $72 $86
Actual return on plan assets 1,261 2,873 256 146 336 (217) 69
Company contributions ——84 131 97 98 53 61
Plan participant contributions ——11——129 138
Settlements and curtailments ——(5) (80) —(7) ——
Benefits paid (923) (871) (68) (80) (226) (217) (248)(237)
Federal subsidy on benefits paid n/a n/a n/a n/a n/a n/a 16 15
Foreign currency exchange rate changes n/a n/a (161) 33 n/a n/a n/a n/a
Fair value, December 31 $ 18,614 $ 18,276 $ 2,564 $ 2,457 $ 2,927 $ 2,720 $28 $72
Change in projected benefit obligation
Projected benefit obligation, January 1 $ 14,145 $ 15,655 $ 2,580 $ 2,460 $ 3,070 $ 3,334 $ 1,356 $1,574
Service cost ——29 32 1189
Interest cost 665 623 109 98 133 120 58 54
Plan participant contributions ——11——129 138
Plan amendments ——12————
Settlements and curtailments —17 (6) (116) —(7) ——
Actuarial loss (gain) 1,621 (1,279) 208 156 351 (161) 29 (197)
Benefits paid (923) (871) (68) (80) (226) (217) (248)(237)
Federal subsidy on benefits paid n/a n/a n/a n/a n/a n/a 16 15
Foreign currency exchange rate changes n/a n/a (166) 27 n/a n/a (2)—
Projected benefit obligation, December 31 $ 15,508 $ 14,145 $ 2,688 $ 2,580 $ 3,329 $ 3,070 $ 1,346 $1,356
Amount recognized, December 31 $ 3,106 $ 4,131 $ (124) $ (123) $ (402) $ (350) $(1,318)$ (1,284)
Funded status, December 31
Accumulated benefit obligation $ 15,508 $ 14,145 $ 2,582 $ 2,463 $ 3,329 $ 3,067 n/a n/a
Overfunded (unfunded) status of ABO 3,106 4,131 (18) (6) (402) (347) n/a n/a
Provision for future salaries ——106 117 —3n/a n/a
Projected benefit obligation 15,508 14,145 2,688 2,580 3,329 3,070 $ 1,346 $1,356
Weighted-average assumptions, December 31
Discount rate 4.12% 4.85% 3.56%4.30% 3.80%4.55% 3.75%4.50%
Rate of compensation increase n/a n/a 4.70 4.91 4.00 4.00 n/a n/a
(1) The measurement date for the Qualified Pension Plan, Non-U.S. Pension Plans, Nonqualified and Other Pension Plans, and Postretirement Health and Life Plans was December 31 of each year
reported.
n/a = not applicable
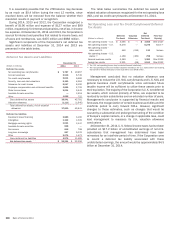
Amounts recognized on the Consolidated Balance Sheet at December 31, 2014 and 2013 are presented in the table below.
Amounts Recognized on Consolidated Balance Sheet
Qualified
Pension Plan
Non-U.S.
Pension Plans
Nonqualified
and Other
Pension Plans
Postretirement
Health and Life
Plans
(Dollars in millions) 2014 2013 2014 2013 2014 2013 2014 2013
Other assets $ 3,106 $ 4,131 $252 $ 205 $786 $ 777 $—$—
Accrued expenses and other liabilities ——(376) (328) (1,188)(1,127) (1,318)(1,284)
Net amount recognized at December 31 $ 3,106 $ 4,131 $ (124) $ (123) $ (402) $ (350) $(1,318)$ (1,284)