Bank of America 2013 Annual Report Download - page 100
Download and view the complete annual report
Please find page 100 of the 2013 Bank of America annual report below. You can navigate through the pages in the report by either clicking on the pages listed below, or by using the keyword search tool below to find specific information within the annual report.-
 1
1 -
2
-
3
-
4
-
5
-
6
-
7
-
8
-
9
-
10
-
11
-
12
-
13
-
14
-
15
-
16
-
17
-
18
-
19
-
20
-
21
-
22
-
23
-
24
-
25
-
26
-
27
-
28
-
29
-
30
-
31
-
32
-
33
-
34
-
35
-
36
-
37
-
38
-
39
-
40
-
41
-
42
-
43
-
44
-
45
-
46
-
47
-
48
-
49
-
50
-
51
-
52
-
53
-
54
-
55
-
56
-
57
-
58
-
59
-
60
-
61
-
62
-
63
-
64
-
65
-
66
-
67
-
68
-
69
-
70
-
71
-
72
-
73
-
74
-
75
-
76
-
77
-
78
-
79
-
80
-
81
-
82
-
83
-
84
-
85
-
86
-
87
-
88
-
89
-
 90
90 -
 91
91 -
 92
92 -
 93
93 -
 94
94 -
 95
95 -
 96
96 -
 97
97 -
 98
98 -
 99
99 -
 100
100 -
 101
101 -
 102
102 -
 103
103 -
 104
104 -
 105
105 -
 106
106 -
 107
107 -
 108
108 -
 109
109 -
 110
110 -
111
-
112
-
113
-
114
-
115
-
116
-
117
-
118
-
119
-
120
-
121
-
122
-
123
-
124
-
125
-
126
-
127
-
128
-
129
-
130
-
131
-
132
-
133
-
134
-
135
-
136
-
137
-
138
-
139
-
140
-
141
-
142
-
143
-
144
-
145
-
146
-
147
-
148
-
149
-
150
-
151
-
152
-
153
-
154
-
155
-
156
-
157
-
158
-
159
-
160
-
161
-
162
-
163
-
164
-
165
-
166
-
167
-
168
-
169
-
170
-
171
-
172
-
173
-
174
-
175
-
176
-
177
-
178
-
179
-
180
-
181
-
182
-
183
-
184
-
185
-
186
-
187
-
188
-
189
-
190
-
191
-
192
-
193
-
194
-
195
-
196
-
197
-
198
-
199
-
200
-
201
-
202
-
203
-
204
-
205
-
206
-
207
-
208
-
209
-
210
-
211
-
212
-
213
-
214
-
215
-
216
-
217
-
218
-
219
-
220
-
221
-
222
-
223
-
224
-
225
-
226
-
227
-
228
-
229
-
230
-
231
-
232
-
233
-
234
-
235
-
236
-
237
-
238
-
239
-
240
-
241
-
242
-
243
-
244
-
245
-
246
-
247
-
248
-
249
-
250
-
251
-
252
-
253
-
254
-
255
-
256
-
257
-
258
-
259
-
260
-
261
-
262
-
263
-
264
-
265
-
266
-
267
-
268
-
269
-
270
-
271
-
272
-
273
-
274
-
275
-
276
-
277
-
278
-
279
-
280
-
281
-
282
-
283
-
284
 |
 |

98 Bank of America 2013
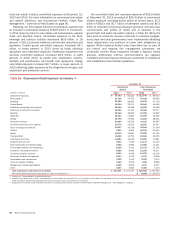
Table 61 presents our direct sovereign and non-sovereign
exposures in these countries at December 31, 2013. Our total
sovereign and non-sovereign exposure to these countries was
$17.1 billion at December 31, 2013 compared to $14.5 billion at
December 31, 2012. The total exposure to these countries, net
of all hedges, was $10.4 billion at December 31, 2013 compared
to $9.5 billion at December 31, 2012. At December 31, 2013 and
2012, hedges and credit default protection purchased, net of credit
default protection sold, was $6.8 billion and $5.1 billion. Net
country exposure increased $901 million in 2013 driven by
increased funded loan and loan equivalents with financial
institutions in Spain and Italy, partially offset by a decrease in total
sovereign exposures.
Table 61 Select European Countries
(Dollars in millions)
Funded Loans
and Loan
Equivalents
Unfunded
Loan
Commitments
Net
Counterparty
Exposure (1)
Securities/
Other
Investments (2)
Country
Exposure at
December 31
2013
Hedges and
Credit Default
Protection (3)
Net Country
Exposure at
December 31
2013
Increase
(Decrease) from
December 31
2012
Greece
Sovereign $ —$ —$ —$ 58$ 58$ —$58 $56
Financial institutions — — — 27 27 (30) (3)2
Corporates 63 61 2 13 139 (41) 98 (211)
Total Greece $ 63 $ 61 $ 2 $ 98 $ 224 $ (71) $153 $ (153)
Ireland
Sovereign $ 19 $ — $ 19 $ — $ 38 $ (43) $(5)$ (63)
Financial institutions 812 10 124 44 990 (10) 980 388
Corporates 356 338 69 55 818 (49) 769 (160)
Total Ireland $ 1,187 $ 348 $ 212 $ 99 $ 1,846 $ (102) $ 1,744 $ 165
Italy
Sovereign $ 2 $ — $ 1,611 $ 269 $ 1,882 $ (2,095) $(213)$ (243)
Financial institutions 1,938 348 179 175 2,640 (1,230) 1,410 333
Corporates 1,156 3,225 538 319 5,238 (1,233) 4,005 274
Total Italy $ 3,096 $ 3,573 $ 2,328 $ 763 $ 9,760 $ (4,558) $ 5,202 $ 364
Portugal
Sovereign $ — $ — $ 15 $ 35 $ 50 $ (27) $23 $60
Financial institutions 4 — 2 — 6 (108) (102)(140)
Corporates 90 103 — 40 233 (292) (59) (144)
Total Portugal $ 94 $ 103 $ 17 $ 75 $ 289 $ (427) $(138)$ (224)
Spain
Sovereign $ 37 $ — $ 63 $ 2 $ 102 $ (163) $(61)
$ (288)
Financial institutions 1,223 1 14 131 1,369 (421) 948 790
Corporates 2,215 891 38 386 3,530 (1,014) 2,516 247
Total Spain $ 3,475 $ 892 $ 115 $ 519 $ 5,001 $ (1,598) $ 3,403 $ 749
Total
Sovereign $ 58 $ — $ 1,708 $ 364 $ 2,130 $ (2,328) $(198)$ (478)
Financial institutions 3,977 359 319 377 5,032 (1,799) 3,233 1,373
Corporates 3,880 4,618 647 813 9,958 (2,629) 7,329 6
Total select European
exposure $ 7,915 $ 4,977 $ 2,674 $ 1,554 $ 17,120 $ (6,756) $10,364 $ 901
(1) Net counterparty exposure includes the fair value of derivatives, including the counterparty risk associated with CDS, and secured financing transactions. Derivative exposures are presented net of
$1.1 billion in collateral, which is predominantly cash, pledged under legally enforceable master netting agreements. Secured financing transaction exposures are presented net of eligible cash or
securities pledged as collateral. The notional amount of reverse repurchase transactions was $4.0 billion. Counterparty exposure is not presented net of hedges or credit default protection.
(2) Long securities exposures are netted on a single-name basis to, but not below, zero by short exposures of $4.9 billion and net CDS purchased of $1.9 billion, consisting of $1.5 billion of net single-
name CDS purchased and $406 million of net indexed and tranched CDS purchased.
(3) Represents credit default protection purchased, net of credit default protection sold, which is used to mitigate the Corporation’s risk to country exposures as listed, including $4.5 billion, consisting
of $3.0 billion in net single-name CDS purchased and $1.5 billion in net indexed and tranched CDS purchased, to hedge loans and securities, $2.3 billion in additional credit default protection
purchased to hedge derivative assets and $127 million in other short exposures.
The majority of our CDS contracts on reference assets in
Greece, Ireland, Italy, Portugal and Spain are with highly-rated
financial institutions primarily outside of the Eurozone and we work
to limit or eliminate correlated CDS. Due to our engagement in
market-making activities, our CDS portfolio contains contracts with
various maturities to a diverse set of counterparties. We work to
limit mismatches in maturities between our exposures and the
CDS we use to hedge them. However, there may be instances
where the protection purchased has a different maturity than the
exposure for which the protection was purchased, in which case,
those exposures and hedges are subject to more active monitoring
and management.