Bank of America 2013 Annual Report Download - page 187
Download and view the complete annual report
Please find page 187 of the 2013 Bank of America annual report below. You can navigate through the pages in the report by either clicking on the pages listed below, or by using the keyword search tool below to find specific information within the annual report.-
 1
1 -
2
-
3
-
4
-
5
-
6
-
7
-
8
-
9
-
10
-
11
-
12
-
13
-
14
-
15
-
16
-
17
-
18
-
19
-
20
-
21
-
22
-
23
-
24
-
25
-
26
-
27
-
28
-
29
-
30
-
31
-
32
-
33
-
34
-
35
-
36
-
37
-
38
-
39
-
40
-
41
-
42
-
43
-
44
-
45
-
46
-
47
-
48
-
49
-
50
-
51
-
52
-
53
-
54
-
55
-
56
-
57
-
58
-
59
-
60
-
61
-
62
-
63
-
64
-
65
-
66
-
67
-
68
-
69
-
70
-
71
-
72
-
73
-
74
-
75
-
76
-
77
-
78
-
79
-
80
-
81
-
82
-
83
-
84
-
85
-
86
-
87
-
88
-
89
-
90
-
91
-
92
-
93
-
94
-
95
-
96
-
97
-
98
-
99
-
100
-
101
-
102
-
103
-
104
-
105
-
106
-
107
-
108
-
109
-
110
-
111
-
112
-
113
-
114
-
115
-
116
-
117
-
118
-
119
-
120
-
121
-
122
-
123
-
124
-
125
-
126
-
127
-
128
-
129
-
130
-
131
-
132
-
133
-
134
-
135
-
136
-
137
-
138
-
139
-
140
-
141
-
142
-
143
-
144
-
145
-
146
-
147
-
148
-
149
-
150
-
151
-
152
-
153
-
154
-
155
-
156
-
157
-
158
-
159
-
160
-
161
-
162
-
163
-
164
-
165
-
166
-
167
-
168
-
169
-
170
-
171
-
172
-
173
-
174
-
175
-
176
-
 177
177 -
 178
178 -
 179
179 -
 180
180 -
 181
181 -
 182
182 -
 183
183 -
 184
184 -
 185
185 -
 186
186 -
 187
187 -
 188
188 -
 189
189 -
 190
190 -
 191
191 -
 192
192 -
 193
193 -
 194
194 -
 195
195 -
 196
196 -
 197
197 -
198
-
199
-
200
-
201
-
202
-
203
-
204
-
205
-
206
-
207
-
208
-
209
-
210
-
211
-
212
-
213
-
214
-
215
-
216
-
217
-
218
-
219
-
220
-
221
-
222
-
223
-
224
-
225
-
226
-
227
-
228
-
229
-
230
-
231
-
232
-
233
-
234
-
235
-
236
-
237
-
238
-
239
-
240
-
241
-
242
-
243
-
244
-
245
-
246
-
247
-
248
-
249
-
250
-
251
-
252
-
253
-
254
-
255
-
256
-
257
-
258
-
259
-
260
-
261
-
262
-
263
-
264
-
265
-
266
-
267
-
268
-
269
-
270
-
271
-
272
-
273
-
274
-
275
-
276
-
277
-
278
-
279
-
280
-
281
-
282
-
283
-
284
 |
 |

Bank of America 2013 185
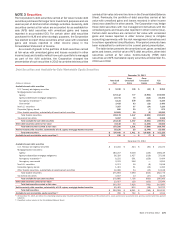
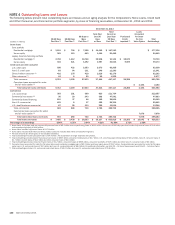
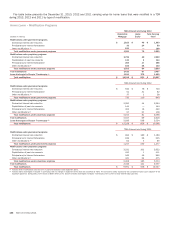
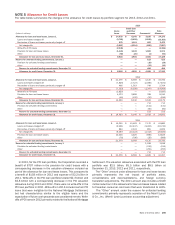
Home Loans – Credit Quality Indicators (1)
December 31, 2012
(Dollars in millions)
Core Portfolio
Residential
Mortgage (2)
Legacy Assets
& Servicing
Residential
Mortgage (2)
Residential
Mortgage PCI (3)
Core Portfolio
Home Equity (2)
Legacy Assets
& Servicing
Home Equity (2)
Home
Equity PCI
Refreshed LTV (4)
Less than or equal to 90 percent $ 80,585 $ 20,613 $ 8,581 $ 44,971 $ 15,922 $2,074
Greater than 90 percent but less than or equal to 100 percent 8,891 5,097 2,368 5,825 4,507 805
Greater than 100 percent 12,984 16,454 6,502 10,055 18,193 5,788
Fully-insured loans (5) 67,656 23,198 — — — —
Total home loans $ 170,116 $ 65,362 $ 17,451 $ 60,851 $ 38,622 $8,667
Refreshed FICO score
Less than 620 $ 6,366 $ 14,320 $ 8,647 $ 2,586 $ 5,411 $ 1,989
Greater than or equal to 620 and less than 680 8,561 6,157 2,712 4,500 5,921 1,529
Greater than or equal to 680 and less than 740 25,141 8,611 2,976 12,625 10,395 2,299
Greater than or equal to 740 62,392 13,076 3,116 41,140 16,895 2,850
Fully-insured loans (5) 67,656 23,198 — — — —
Total home loans $ 170,116 $ 65,362 $ 17,451 $ 60,851 $ 38,622 $8,667
(1) Excludes $1.0 billion of loans accounted for under the fair value option.
(2) Excludes PCI loans.
(3) Includes $6.1 billion of pay option loans. The Corporation no longer originates this product.
(4) Refreshed LTV percentages for PCI loans are calculated using the carrying value net of the related valuation allowance.
(5) Credit quality indicators are not reported for fully-insured loans as principal repayment is insured.
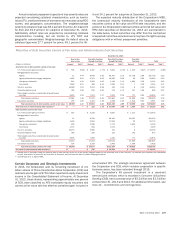
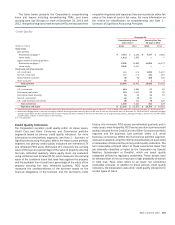
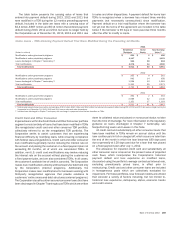
Credit Card and Other Consumer – Credit Quality Indicators
December 31, 2012
(Dollars in millions)
U.S. Credit
Card
Non-U.S.
Credit Card
Direct/Indirect
Consumer
Other
Consumer (1)
Refreshed FICO score
Less than 620 $ 6,188 $ — $ 1,896 $ 668
Greater than or equal to 620 and less than 680 13,947 — 3,367 301
Greater than or equal to 680 and less than 740 37,167 — 9,592 232
Greater than or equal to 740 37,533 — 25,164 212
Other internal credit metrics (2, 3, 4) — 11,697 43,186 215
Total credit card and other consumer $ 94,835 $ 11,697 $ 83,205 $1,628
(1) 87 percent of the other consumer portfolio is associated with portfolios from certain consumer finance businesses that the Corporation previously exited.
(2) Other internal credit metrics may include delinquency status, geography or other factors.
(3) Direct/indirect consumer includes $36.5 billion of securities-based lending which is overcollateralized and therefore has minimal credit risk and $4.8 billion of loans the Corporation no longer
originates.
(4) Non-U.S. credit card represents the U.K. credit card portfolio which is evaluated using internal credit metrics, including delinquency status. At December 31, 2012, 97 percent of this portfolio was
current or less than 30 days past due, one percent was 30-89 days past due and two percent was 90 days or more past due.
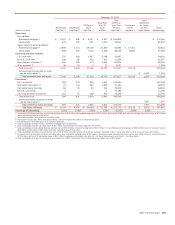
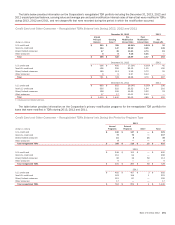
Commercial – Credit Quality Indicators (1)
December 31, 2012
(Dollars in millions)
U.S.
Commercial
Commercial
Real Estate
Commercial
Lease
Financing
Non-U.S.
Commercial
U.S. Small
Business
Commercial (2)
Risk ratings
Pass rated $ 189,602 $ 34,968 $ 22,874 $ 72,688 $1,690
Reservable criticized 7,524 3,669 969 1,496 573
Refreshed FICO score (3)
Less than 620 400
Greater than or equal to 620 and less than 680 580
Greater than or equal to 680 and less than 740 1,553
Greater than or equal to 740 2,496
Other internal credit metrics (3, 4) 5,301
Total commercial $ 197,126 $ 38,637 $ 23,843 $ 74,184 $12,593
(1) Excludes $8.0 billion of loans accounted for under the fair value option.
(2) U.S. small business commercial includes $366 million of criticized business card and small business loans which are evaluated using refreshed FICO scores or internal credit metrics, including
delinquency status, rather than risk ratings. At December 31, 2012, 98 percent of the balances where internal credit metrics are used was current or less than 30 days past due.
(3) Refreshed FICO score and other internal credit metrics are applicable only to the U.S. small business commercial portfolio.
(4) Other internal credit metrics may include delinquency status, application scores, geography or other factors.