Bank of America 2013 Annual Report Download - page 102
Download and view the complete annual report
Please find page 102 of the 2013 Bank of America annual report below. You can navigate through the pages in the report by either clicking on the pages listed below, or by using the keyword search tool below to find specific information within the annual report.-
 1
1 -
2
-
3
-
4
-
5
-
6
-
7
-
8
-
9
-
10
-
11
-
12
-
13
-
14
-
15
-
16
-
17
-
18
-
19
-
20
-
21
-
22
-
23
-
24
-
25
-
26
-
27
-
28
-
29
-
30
-
31
-
32
-
33
-
34
-
35
-
36
-
37
-
38
-
39
-
40
-
41
-
42
-
43
-
44
-
45
-
46
-
47
-
48
-
49
-
50
-
51
-
52
-
53
-
54
-
55
-
56
-
57
-
58
-
59
-
60
-
61
-
62
-
63
-
64
-
65
-
66
-
67
-
68
-
69
-
70
-
71
-
72
-
73
-
74
-
75
-
76
-
77
-
78
-
79
-
80
-
81
-
82
-
83
-
84
-
85
-
86
-
87
-
88
-
89
-
90
-
91
-
 92
92 -
 93
93 -
 94
94 -
 95
95 -
 96
96 -
 97
97 -
 98
98 -
 99
99 -
 100
100 -
 101
101 -
 102
102 -
 103
103 -
 104
104 -
 105
105 -
 106
106 -
 107
107 -
 108
108 -
 109
109 -
 110
110 -
 111
111 -
 112
112 -
113
-
114
-
115
-
116
-
117
-
118
-
119
-
120
-
121
-
122
-
123
-
124
-
125
-
126
-
127
-
128
-
129
-
130
-
131
-
132
-
133
-
134
-
135
-
136
-
137
-
138
-
139
-
140
-
141
-
142
-
143
-
144
-
145
-
146
-
147
-
148
-
149
-
150
-
151
-
152
-
153
-
154
-
155
-
156
-
157
-
158
-
159
-
160
-
161
-
162
-
163
-
164
-
165
-
166
-
167
-
168
-
169
-
170
-
171
-
172
-
173
-
174
-
175
-
176
-
177
-
178
-
179
-
180
-
181
-
182
-
183
-
184
-
185
-
186
-
187
-
188
-
189
-
190
-
191
-
192
-
193
-
194
-
195
-
196
-
197
-
198
-
199
-
200
-
201
-
202
-
203
-
204
-
205
-
206
-
207
-
208
-
209
-
210
-
211
-
212
-
213
-
214
-
215
-
216
-
217
-
218
-
219
-
220
-
221
-
222
-
223
-
224
-
225
-
226
-
227
-
228
-
229
-
230
-
231
-
232
-
233
-
234
-
235
-
236
-
237
-
238
-
239
-
240
-
241
-
242
-
243
-
244
-
245
-
246
-
247
-
248
-
249
-
250
-
251
-
252
-
253
-
254
-
255
-
256
-
257
-
258
-
259
-
260
-
261
-
262
-
263
-
264
-
265
-
266
-
267
-
268
-
269
-
270
-
271
-
272
-
273
-
274
-
275
-
276
-
277
-
278
-
279
-
280
-
281
-
282
-
283
-
284
 |
 |
100 Bank of America 2013
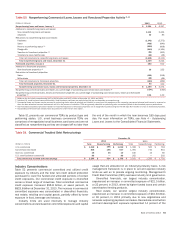
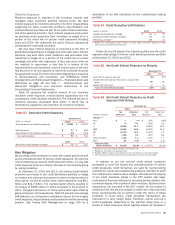
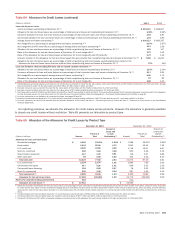
Provision for Credit Losses
The provision for credit losses decreased $4.6 billion to $3.6
billion in 2013 compared to 2012. The provision for credit losses
was $4.3 billion lower than net charge-offs for 2013, resulting in
a reduction in the allowance for credit losses due to continued
improvement in the home loans and credit card portfolios. This
compared to a reduction of $6.7 billion in the allowance for credit
losses for 2012. If the economy and our asset quality continue to
improve, we anticipate additional reductions in the allowance for
credit losses in future periods, although at a significantly lower
level than in 2013.
The provision for credit losses for the consumer portfolio
decreased $6.0 billion to $2.0 billion in 2013 compared to 2012,
due to continued improvement in the home loans portfolio primarily
as a result of improved delinquencies, increased home prices, and
continued loan balance run-off, as well as improvement in the credit
card portfolios primarily driven by lower delinquencies. The
provision for credit losses related to the PCI loan portfolio was a
benefit of $707 million in 2013 primarily due to improvement in
our home price outlook compared to a benefit of $103 million in
2012.
The provision for credit losses for the commercial portfolio,
including unfunded lending commitments, increased $1.3 billion
to $1.5 billion in 2013 compared to 2012 due to stabilization of
credit quality, an increase in reserves due to loan growth and a
higher volume of loan resolutions in the prior year within the core
commercial portfolio.
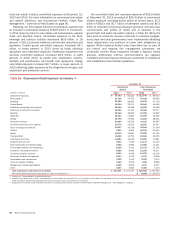
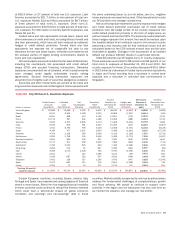
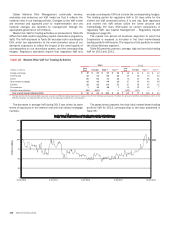
Allowance for Credit Losses
Allowance for Loan and Lease Losses
The allowance for loan and lease losses is comprised of two
components. The first component covers nonperforming
commercial loans and TDRs. The second component covers loans
and leases on which there are incurred losses that are not yet
individually identifiable, as well as incurred losses that may not
be represented in the loss forecast models. We evaluate the
adequacy of the allowance for loan and lease losses based on the
total of these two components, each of which is described in more
detail below. The allowance for loan and lease losses excludes
LHFS and loans accounted for under the fair value option as the
fair value reflects a credit risk component.
The first component of the allowance for loan and lease losses
covers both nonperforming commercial loans and all TDRs within
the consumer and commercial portfolios. These loans are subject
to impairment measurement based on the present value of
projected future cash flows discounted at the loan’s original
effective interest rate, or in certain circumstances, impairment
may also be based upon the collateral value or the loan’s
observable market price if available. Impairment measurement for
the renegotiated consumer credit card, small business credit card
and unsecured consumer TDR portfolios is based on the present
value of projected cash flows discounted using the average
portfolio contractual interest rate, excluding promotionally priced
loans, in effect prior to restructuring. For purposes of computing
this specific loss component of the allowance, larger impaired
loans are evaluated individually and smaller impaired loans are
evaluated as a pool using historical experience for the respective
product types and risk ratings of the loans.
The second component of the allowance for loan and lease
losses covers the remaining consumer and commercial loans and
leases that have incurred losses which are not yet individually
identifiable. The allowance for consumer and certain
homogeneous commercial loan and lease products is based on
aggregated portfolio evaluations, generally by product type. Loss
forecast models are utilized that consider a variety of factors
including, but not limited to, historical loss experience, estimated
defaults or foreclosures based on portfolio trends, delinquencies,
economic trends and credit scores. Our consumer real estate loss
forecast model estimates the portion of loans that will default
based on individual loan attributes, the most significant of which
are refreshed LTV or CLTV, and borrower credit score as well as
vintage and geography, all of which are further broken down into
current delinquency status. Additionally, we incorporate the
delinquency status of underlying first-lien loans on our junior-lien
home equity portfolio in our allowance process. Incorporating
refreshed LTV and CLTV into our probability of default allows us to
factor the impact of changes in home prices into our allowance
for loan and lease losses. These loss forecast models are updated
on a quarterly basis to incorporate information reflecting the
current economic environment. As of December 31, 2013, the loss
forecast process resulted in reductions in the allowance for all
major consumer portfolios.
The allowance for commercial loan and lease losses is
established by product type after analyzing historical loss
experience, internal risk rating, current economic conditions,
industry performance trends, geographic and obligor
concentrations within each portfolio and any other pertinent
information. The statistical models for commercial loans are
generally updated annually and utilize our historical database of
actual defaults and other data. The loan risk ratings and
composition of the commercial portfolios used to calculate the
allowance are updated quarterly to incorporate the most recent
data reflecting the current economic environment. For risk-rated
commercial loans, we estimate the probability of default and the
LGD based on our historical experience of defaults and credit
losses. Factors considered when assessing the internal risk rating
include the value of the underlying collateral, if applicable, the
industry in which the obligor operates, the obligor’s liquidity and
other financial indicators, and other quantitative and qualitative
factors relevant to the obligor’s credit risk. As of December 31,
2013, changes in portfolio size and composition resulted in an
increase in the allowance for all major commercial portfolios.
Also included within the second component of the allowance
for loan and lease losses are reserves to cover losses that are
incurred but, in our assessment, may not be adequately
represented in the historical loss data used in the loss forecast
models. For example, factors that we consider include, among
others, changes in lending policies and procedures, changes in
economic and business conditions, changes in the nature and size
of the portfolio, changes in portfolio concentrations, changes in
the volume and severity of past due loans and nonaccrual loans,
the effect of external factors such as competition, and legal and
regulatory requirements. We also consider factors that are
applicable to unique portfolio segments. For example, we consider
the risk of uncertainty in our loss forecasting models related to
junior-lien home equity loans that are current, but have first-lien
loans that we do not service that are 30 days or more past due.
In addition, we consider the increased risk of default associated
with our interest-only loans that have yet to enter the amortization
period. Given the heightened risk of loss with these loans,
additional reserves are recorded to the allowance for loan and