Bank of America 2013 Annual Report Download - page 42
Download and view the complete annual report
Please find page 42 of the 2013 Bank of America annual report below. You can navigate through the pages in the report by either clicking on the pages listed below, or by using the keyword search tool below to find specific information within the annual report.-
 1
1 -
2
-
3
-
4
-
5
-
6
-
7
-
8
-
9
-
10
-
11
-
12
-
13
-
14
-
15
-
16
-
17
-
18
-
19
-
20
-
21
-
22
-
23
-
24
-
25
-
26
-
27
-
28
-
29
-
30
-
31
-
 32
32 -
 33
33 -
 34
34 -
 35
35 -
 36
36 -
 37
37 -
 38
38 -
 39
39 -
 40
40 -
 41
41 -
 42
42 -
 43
43 -
 44
44 -
 45
45 -
 46
46 -
 47
47 -
 48
48 -
 49
49 -
 50
50 -
 51
51 -
 52
52 -
53
-
54
-
55
-
56
-
57
-
58
-
59
-
60
-
61
-
62
-
63
-
64
-
65
-
66
-
67
-
68
-
69
-
70
-
71
-
72
-
73
-
74
-
75
-
76
-
77
-
78
-
79
-
80
-
81
-
82
-
83
-
84
-
85
-
86
-
87
-
88
-
89
-
90
-
91
-
92
-
93
-
94
-
95
-
96
-
97
-
98
-
99
-
100
-
101
-
102
-
103
-
104
-
105
-
106
-
107
-
108
-
109
-
110
-
111
-
112
-
113
-
114
-
115
-
116
-
117
-
118
-
119
-
120
-
121
-
122
-
123
-
124
-
125
-
126
-
127
-
128
-
129
-
130
-
131
-
132
-
133
-
134
-
135
-
136
-
137
-
138
-
139
-
140
-
141
-
142
-
143
-
144
-
145
-
146
-
147
-
148
-
149
-
150
-
151
-
152
-
153
-
154
-
155
-
156
-
157
-
158
-
159
-
160
-
161
-
162
-
163
-
164
-
165
-
166
-
167
-
168
-
169
-
170
-
171
-
172
-
173
-
174
-
175
-
176
-
177
-
178
-
179
-
180
-
181
-
182
-
183
-
184
-
185
-
186
-
187
-
188
-
189
-
190
-
191
-
192
-
193
-
194
-
195
-
196
-
197
-
198
-
199
-
200
-
201
-
202
-
203
-
204
-
205
-
206
-
207
-
208
-
209
-
210
-
211
-
212
-
213
-
214
-
215
-
216
-
217
-
218
-
219
-
220
-
221
-
222
-
223
-
224
-
225
-
226
-
227
-
228
-
229
-
230
-
231
-
232
-
233
-
234
-
235
-
236
-
237
-
238
-
239
-
240
-
241
-
242
-
243
-
244
-
245
-
246
-
247
-
248
-
249
-
250
-
251
-
252
-
253
-
254
-
255
-
256
-
257
-
258
-
259
-
260
-
261
-
262
-
263
-
264
-
265
-
266
-
267
-
268
-
269
-
270
-
271
-
272
-
273
-
274
-
275
-
276
-
277
-
278
-
279
-
280
-
281
-
282
-
283
-
284
 |
 |

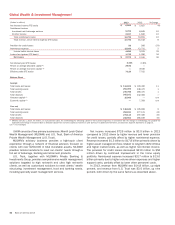
40 Bank of America 2013
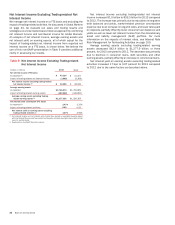
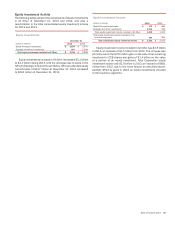
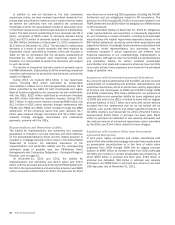
Global Wealth & Investment Management
(Dollars in millions) 2013 2012 % Change
Net interest income (FTE basis) $ 6,064 $ 5,827 4%
Noninterest income:
Investment and brokerage services 9,709 8,849 10
All other income 2,017 1,842 10
Total noninterest income 11,726 10,691 10
Total revenue, net of interest expense (FTE basis) 17,790 16,518 8
Provision for credit losses 56 266 (79)
Noninterest expense 13,038 12,721 2
Income before income taxes 4,696 3,531 33
Income tax expense (FTE basis) 1,722 1,286 34
Net income $ 2,974 $ 2,245 32
Net interest yield (FTE basis) 2.41%2.35%
Return on average allocated capital (1) 29.90 —
Return on average economic capital (1) —30.80
Efficiency ratio (FTE basis) 73.29 77.02
Balance Sheet
Average
Total loans and leases $ 111,023 $ 100,456 11
Total earning assets 251,394 248,475 1
Total assets 270,788 268,475 1
Total deposits 242,161 242,384 —
Allocated capital (1) 10,000 — n/m
Economic capital (1) —7,359 n/m
Year end
Total loans and leases $ 115,846 $ 105,928 9
Total earning assets 254,031 277,121 (8)
Total assets 274,112 297,326 (8)
Total deposits 244,901 266,188 (8)
(1) Effective January 1, 2013, we revised, on a prospective basis, the methodology for allocating capital to the business segments. In connection with the change in methodology, we updated the
applicable terminology in the above table to allocated capital from economic capital as reported in prior periods. For additional information, see Business Segment Operations on page 31.
n/m = not meaningful
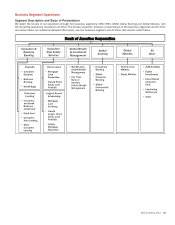
GWIM consists of two primary businesses: Merrill Lynch Global
Wealth Management (MLGWM) and U.S. Trust, Bank of America
Private Wealth Management (U.S. Trust).
MLGWM’s advisory business provides a high-touch client
experience through a network of financial advisors focused on
clients with over $250,000 in total investable assets. MLGWM
provides tailored solutions to meet our clients’ needs through a
full set of brokerage, banking and retirement products.
U.S. Trust, together with MLGWM’s Private Banking &
Investments Group, provides comprehensive wealth management
solutions targeted to high net-worth and ultra high net-worth
clients, as well as customized solutions to meet clients’ wealth
structuring, investment management, trust and banking needs,
including specialty asset management services.
Net income increased $729 million to $3.0 billion in 2013
compared to 2012 driven by higher revenue and lower provision
for credit losses, partially offset by higher noninterest expense.
Revenue increased $1.3 billion to $17.8 billion primarily driven by
higher asset management fees related to long-term AUM inflows
and higher market levels, as well as higher net interest income.
The provision for credit losses decreased $210 million to $56
million driven by continued improvement in the home equity
portfolio. Noninterest expense increased $317 million to $13.0
billion primarily due to higher volume-driven expenses and higher
support costs, partially offset by lower other personnel costs.
In 2013, revenue from MLGWM was $14.8 billion, up eight
percent, and revenue from U.S. Trust was $3.0 billion, up nine
percent, both driven by the same factors as described above.