Bank of America 2013 Annual Report Download - page 53
Download and view the complete annual report
Please find page 53 of the 2013 Bank of America annual report below. You can navigate through the pages in the report by either clicking on the pages listed below, or by using the keyword search tool below to find specific information within the annual report.-
 1
1 -
2
-
3
-
4
-
5
-
6
-
7
-
8
-
9
-
10
-
11
-
12
-
13
-
14
-
15
-
16
-
17
-
18
-
19
-
20
-
21
-
22
-
23
-
24
-
25
-
26
-
27
-
28
-
29
-
30
-
31
-
32
-
33
-
34
-
35
-
36
-
37
-
38
-
39
-
40
-
41
-
42
-
 43
43 -
 44
44 -
 45
45 -
 46
46 -
 47
47 -
 48
48 -
 49
49 -
 50
50 -
 51
51 -
 52
52 -
 53
53 -
 54
54 -
 55
55 -
 56
56 -
 57
57 -
 58
58 -
 59
59 -
 60
60 -
 61
61 -
 62
62 -
 63
63 -
64
-
65
-
66
-
67
-
68
-
69
-
70
-
71
-
72
-
73
-
74
-
75
-
76
-
77
-
78
-
79
-
80
-
81
-
82
-
83
-
84
-
85
-
86
-
87
-
88
-
89
-
90
-
91
-
92
-
93
-
94
-
95
-
96
-
97
-
98
-
99
-
100
-
101
-
102
-
103
-
104
-
105
-
106
-
107
-
108
-
109
-
110
-
111
-
112
-
113
-
114
-
115
-
116
-
117
-
118
-
119
-
120
-
121
-
122
-
123
-
124
-
125
-
126
-
127
-
128
-
129
-
130
-
131
-
132
-
133
-
134
-
135
-
136
-
137
-
138
-
139
-
140
-
141
-
142
-
143
-
144
-
145
-
146
-
147
-
148
-
149
-
150
-
151
-
152
-
153
-
154
-
155
-
156
-
157
-
158
-
159
-
160
-
161
-
162
-
163
-
164
-
165
-
166
-
167
-
168
-
169
-
170
-
171
-
172
-
173
-
174
-
175
-
176
-
177
-
178
-
179
-
180
-
181
-
182
-
183
-
184
-
185
-
186
-
187
-
188
-
189
-
190
-
191
-
192
-
193
-
194
-
195
-
196
-
197
-
198
-
199
-
200
-
201
-
202
-
203
-
204
-
205
-
206
-
207
-
208
-
209
-
210
-
211
-
212
-
213
-
214
-
215
-
216
-
217
-
218
-
219
-
220
-
221
-
222
-
223
-
224
-
225
-
226
-
227
-
228
-
229
-
230
-
231
-
232
-
233
-
234
-
235
-
236
-
237
-
238
-
239
-
240
-
241
-
242
-
243
-
244
-
245
-
246
-
247
-
248
-
249
-
250
-
251
-
252
-
253
-
254
-
255
-
256
-
257
-
258
-
259
-
260
-
261
-
262
-
263
-
264
-
265
-
266
-
267
-
268
-
269
-
270
-
271
-
272
-
273
-
274
-
275
-
276
-
277
-
278
-
279
-
280
-
281
-
282
-
283
-
284
 |
 |

Bank of America 2013 51
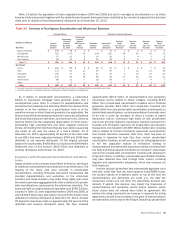
Table 13 details the population of loans originated between 2004 and 2008 and sold in non-agency securitizations or as whole
loans by entity and product together with the defaulted and severely delinquent loans stratified by the number of payments the borrower
made prior to default or becoming severely delinquent as of December 31, 2013.
Table 13 Overview of Non-Agency Securitization and Whole-loan Balances
Principal Balance Defaulted or Severely Delinquent
(Dollars in billions)
By Entity
Original
Principal
Balance
Outstanding
Principal
Balance
December
31, 2013
Outstanding
Principal
Balance
180 Days or
More
Past Due
Defaulted
Principal
Balance
Defaulted or
Severely
Delinquent
Borrower
Made
Less than 13
Payments
Borrower
Made
13 to 24
Payments
Borrower
Made
25 to 36
Payments
Borrower
Made
More than 36
Payments
Bank of America $ 100 $ 18 $ 3 $ 7 $ 10 $ 1 $ 2 $ 2 $ 5
Countrywide 716 173 43 144 187 24 45 45 73
Merrill Lynch 67 15 3 16 19 3 4 3 9
First Franklin 82 15 4 25 29 5 6 5 13
Total (1, 2) $ 965 $ 221 $ 53 $ 192 $ 245 $33$57 $55 $ 100
By Product
Prime $ 302$ 66$ 8$ 26$ 34$ 2$ 6$ 7$ 19
Alt-A 172 50 11 39 50 7 12 12 19
Pay option 150 37 14 41 55 5 13 15 22
Subprime 247 55 18 66 84 17 20 16 31
Home equity 88 11 — 18 182547
Other 62224—112
Total $ 965 $ 221 $ 53 $ 192 $ 245 $33$57 $55 $ 100
(1) Excludes transactions sponsored by Bank of America and Merrill Lynch where no representations or warranties were made.
(2) Includes exposures on third-party sponsored transactions related to legacy entity originations.
As it relates to private-label securitizations, a contractual
liability to repurchase mortgage loans generally arises only if
counterparties prove there is a breach of representations and
warranties that materially and adversely affects the interest of the
investor or all the investors in a securitization trust or of the
monoline insurer or other financial guarantor (as applicable). We
believe many of the loan defaults observed in these securitizations
and whole-loan balances have been, and continue to be, driven by
external factors like the substantial depreciation in home prices,
persistently high unemployment and other negative economic
trends, diminishing the likelihood that any loan defect (assuming
one exists at all) was the cause of a loan’s default. As of
December 31, 2013, approximately 25 percent of the loans sold
to non-GSEs that were originated between 2004 and 2008 have
defaulted or are severely delinquent. Of the original principal
balance for Countrywide, $409 billion is included in the BNY Mellon
Settlement and, of this amount, $109 billion was defaulted or
severely delinquent at December 31, 2013.
Experience with Private-label Securitizations and Whole
Loans
Legacy entities, and to a lesser extent Bank of America, sold loans
to investors via private-label securitizations or as whole loans. The
majority of the loans sold were included in private-label
securitizations, including third-party sponsored transactions. We
provided representations and warranties to the whole-loan
investors and these investors may retain those rights even when
the whole loans were aggregated with other collateral into private-
label securitizations sponsored by the whole-loan investors. The
loans sold with an original total principal balance of $780.5 billion,
included in Table 13, were originated between 2004 and 2008, of
which $449.9 billion have been paid in full and $191.3 billion were
defaulted or severely delinquent at December 31, 2013. At least
25 payments have been made on approximately 64 percent of the
defaulted and severely delinquent loans. We have received
approximately $25.9 billion of representations and warranties
repurchase claims related to these vintages, including $16.9
billion from private-label securitization trustees and a financial
guarantee provider, $8.2 billion from whole-loan investors and
$809 million from one private-label securitization counterparty. In
private-label securitizations, certain presentation thresholds need
to be met in order for investors to direct a trustee to assert
repurchase claims. Continued high levels of new private-label
claims are primarily related to repurchase requests received from
trustees and third-party sponsors for private-label securitization
transactions not included in the BNY Mellon Settlement, including
claims related to first-lien third-party sponsored securitizations
that include monoline insurance. Over time, there has been an
increase in requests for loan files from certain private-label
securitization trustees, as well as requests for tolling agreements
to toll the applicable statute of limitations relating to
representations and warranties repurchase claims, and we believe
it is likely that these requests will lead to an increase in repurchase
claims from private-label securitization trustees with standing to
bring such claims. In addition, private-label securitization trustees
may have obtained loan files through other means, including
litigation and administrative subpoenas, which may increase our
total exposure.
A recent decision by the New York intermediate appellate court
held that, under New York law, which governs many RMBS trusts,
the six-year statute of limitations starts to run at the time the
representations and warranties are made (i.e., the date the
transaction closed and not when the repurchase demand was
denied). If upheld, this decision may impact the timeliness of
representations and warranties claims and/or lawsuits, where
these claims have not already been tolled by agreement. We
believe this ruling may lead to an increase in requests for tolling
agreements as well as an increase in the pace of representations
and warranties claims and/or the filing of lawsuits by private-label