Bank of America 2013 Annual Report Download - page 27
Download and view the complete annual report
Please find page 27 of the 2013 Bank of America annual report below. You can navigate through the pages in the report by either clicking on the pages listed below, or by using the keyword search tool below to find specific information within the annual report.-
 1
1 -
2
-
3
-
4
-
5
-
6
-
7
-
8
-
9
-
10
-
11
-
12
-
13
-
14
-
15
-
16
-
 17
17 -
 18
18 -
 19
19 -
 20
20 -
 21
21 -
 22
22 -
 23
23 -
 24
24 -
 25
25 -
 26
26 -
 27
27 -
 28
28 -
 29
29 -
 30
30 -
 31
31 -
 32
32 -
 33
33 -
 34
34 -
 35
35 -
 36
36 -
 37
37 -
38
-
39
-
40
-
41
-
42
-
43
-
44
-
45
-
46
-
47
-
48
-
49
-
50
-
51
-
52
-
53
-
54
-
55
-
56
-
57
-
58
-
59
-
60
-
61
-
62
-
63
-
64
-
65
-
66
-
67
-
68
-
69
-
70
-
71
-
72
-
73
-
74
-
75
-
76
-
77
-
78
-
79
-
80
-
81
-
82
-
83
-
84
-
85
-
86
-
87
-
88
-
89
-
90
-
91
-
92
-
93
-
94
-
95
-
96
-
97
-
98
-
99
-
100
-
101
-
102
-
103
-
104
-
105
-
106
-
107
-
108
-
109
-
110
-
111
-
112
-
113
-
114
-
115
-
116
-
117
-
118
-
119
-
120
-
121
-
122
-
123
-
124
-
125
-
126
-
127
-
128
-
129
-
130
-
131
-
132
-
133
-
134
-
135
-
136
-
137
-
138
-
139
-
140
-
141
-
142
-
143
-
144
-
145
-
146
-
147
-
148
-
149
-
150
-
151
-
152
-
153
-
154
-
155
-
156
-
157
-
158
-
159
-
160
-
161
-
162
-
163
-
164
-
165
-
166
-
167
-
168
-
169
-
170
-
171
-
172
-
173
-
174
-
175
-
176
-
177
-
178
-
179
-
180
-
181
-
182
-
183
-
184
-
185
-
186
-
187
-
188
-
189
-
190
-
191
-
192
-
193
-
194
-
195
-
196
-
197
-
198
-
199
-
200
-
201
-
202
-
203
-
204
-
205
-
206
-
207
-
208
-
209
-
210
-
211
-
212
-
213
-
214
-
215
-
216
-
217
-
218
-
219
-
220
-
221
-
222
-
223
-
224
-
225
-
226
-
227
-
228
-
229
-
230
-
231
-
232
-
233
-
234
-
235
-
236
-
237
-
238
-
239
-
240
-
241
-
242
-
243
-
244
-
245
-
246
-
247
-
248
-
249
-
250
-
251
-
252
-
253
-
254
-
255
-
256
-
257
-
258
-
259
-
260
-
261
-
262
-
263
-
264
-
265
-
266
-
267
-
268
-
269
-
270
-
271
-
272
-
273
-
274
-
275
-
276
-
277
-
278
-
279
-
280
-
281
-
282
-
283
-
284
 |
 |

Bank of America 2013 25
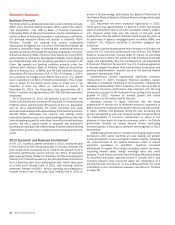
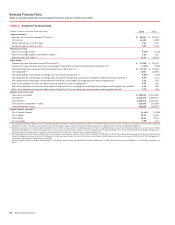
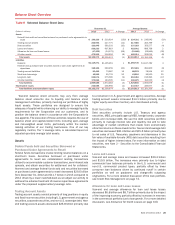
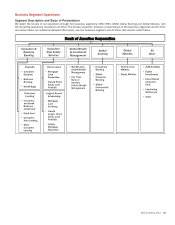
Balance Sheet Overview
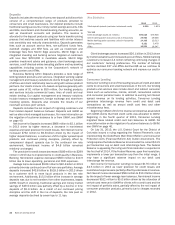
Table 6 Selected Balance Sheet Data
December 31 Average Balance
(Dollars in millions) 2013 2012 % Change 2013 2012 % Change
Assets
Federal funds sold and securities borrowed or purchased under agreements to
resell $ 190,328 $219,924 (13)% $ 224,331 $236,042 (5)%
Trading account assets 200,993 227,775 (12) 217,865 203,799 7
Debt securities 323,945 360,331 (10) 337,953 353,577 (4)
Loans and leases 928,233 907,819 2918,641 898,768 2
Allowance for loan and lease losses (17,428) (24,179) (28) (21,188) (29,843) (29)
All other assets 476,202 518,304 (8) 485,911 529,013 (8)
Total assets $2,102,273 $2,209,974 (5) $2,163,513 $2,191,356 (1)
Liabilities
Deposits $1,119,271 $1,105,261 1 $1,089,735 $1,047,782 4
Federal funds purchased and securities loaned or sold under agreements to
repurchase 198,106 293,259 (32) 257,601 281,900 (9)
Trading account liabilities 83,469 73,587 13 88,323 78,554 12
Short-term borrowings 45,999 30,731 50 43,816 36,500 20
Long-term debt 249,674 275,585 (9) 263,416 316,393 (17)
All other liabilities 173,069 194,595 (11) 186,675 194,550 (4)
Total liabilities 1,869,588 1,973,018 (5) 1,929,566 1,955,679 (1)
Shareholders’ equity 232,685 236,956 (2) 233,947 235,677 (1)
Total liabilities and shareholders’ equity $2,102,273 $2,209,974 (5) $2,163,513 $2,191,356 (1)
Year-end balance sheet amounts may vary from average
balance sheet amounts due to liquidity and balance sheet
management activities, primarily involving our portfolios of highly
liquid assets. These portfolios are designed to ensure the
adequacy of capital while enhancing our ability to manage liquidity
requirements for the Corporation and our customers, and to
position the balance sheet in accordance with the Corporation’s
risk appetite. The execution of these activities requires the use of
balance sheet and capital-related limits including spot, average
and risk-weighted asset limits, particularly within the market-
making activities of our trading businesses. One of our key
regulatory metrics, Tier 1 leverage ratio, is calculated based on
adjusted quarterly average total assets.
Assets
Federal Funds Sold and Securities Borrowed or
Purchased Under Agreements to Resell
Federal funds transactions involve lending reserve balances on a
short-term basis. Securities borrowed or purchased under
agreements to resell are collateralized lending transactions
utilized to accommodate customer transactions, earn interest rate
spreads, and obtain securities for settlement and for collateral.
Year-end and average federal funds sold and securities borrowed
or purchased under agreements to resell decreased $29.6 billion
from December 31, 2012 and $11.7 billion in 2013 compared to
2012 driven by a lower matched-book as we adjust our activity to
address the adverse treatment of reverse repurchase agreements
under the proposed supplementary leverage ratio.
Trading Account Assets
Trading account assets consist primarily of long positions in equity
and fixed-income securities including U.S. government and agency
securities, corporate securities, and non-U.S. sovereign debt. Year-
end trading account assets decreased $26.8 billion primarily due
to a reduction in U.S. government and agency securities. Average
trading account assets increased $14.1 billion primarily due to
higher equity securities inventory and client-based activity.
Debt Securities
Debt securities primarily include U.S. Treasury and agency
securities, MBS, principally agency MBS, foreign bonds, corporate
bonds and municipal debt. We use the debt securities portfolio
primarily to manage interest rate and liquidity risk and to take
advantage of market conditions that create more economically
attractive returns on these investments. Year-end and average debt
securities decreased $36.4 billion and $15.6 billion primarily due
to net sales of U.S. Treasuries, paydowns and decreases in the
fair value of available-for-sale (AFS) debt securities resulting from
the impact of higher interest rates. For more information on debt
securities, see Note 3 – Securities to the Consolidated Financial
Statements.
Loans and Leases
Year-end and average loans and leases increased $20.4 billion
and $19.9 billion. The increases were primarily due to higher
commercial loan balances primarily in the U.S. commercial and
non-U.S. commercial product types, partially offset by lower
consumer loan balances driven by continued runoff in certain
portfolios as well as paydowns and charge-offs outpacing
originations. For a more detailed discussion of the loan portfolio,
see Credit Risk Management on page 72.
Allowance for Loan and Lease Losses
Year-end and average allowance for loan and lease losses
decreased $6.8 billion and $8.7 billion primarily due to the impact
of the improving economy, partially offset by increases in reserves
in the commercial portfolio due to loan growth. For a more detailed
discussion, see Allowance for Credit Losses on page 100.