Bank of America 2013 Annual Report Download - page 114
Download and view the complete annual report
Please find page 114 of the 2013 Bank of America annual report below. You can navigate through the pages in the report by either clicking on the pages listed below, or by using the keyword search tool below to find specific information within the annual report.-
 1
1 -
2
-
3
-
4
-
5
-
6
-
7
-
8
-
9
-
10
-
11
-
12
-
13
-
14
-
15
-
16
-
17
-
18
-
19
-
20
-
21
-
22
-
23
-
24
-
25
-
26
-
27
-
28
-
29
-
30
-
31
-
32
-
33
-
34
-
35
-
36
-
37
-
38
-
39
-
40
-
41
-
42
-
43
-
44
-
45
-
46
-
47
-
48
-
49
-
50
-
51
-
52
-
53
-
54
-
55
-
56
-
57
-
58
-
59
-
60
-
61
-
62
-
63
-
64
-
65
-
66
-
67
-
68
-
69
-
70
-
71
-
72
-
73
-
74
-
75
-
76
-
77
-
78
-
79
-
80
-
81
-
82
-
83
-
84
-
85
-
86
-
87
-
88
-
89
-
90
-
91
-
92
-
93
-
94
-
95
-
96
-
97
-
98
-
99
-
100
-
101
-
102
-
103
-
 104
104 -
 105
105 -
 106
106 -
 107
107 -
 108
108 -
 109
109 -
 110
110 -
 111
111 -
 112
112 -
 113
113 -
 114
114 -
 115
115 -
 116
116 -
 117
117 -
 118
118 -
 119
119 -
 120
120 -
 121
121 -
 122
122 -
 123
123 -
 124
124 -
125
-
126
-
127
-
128
-
129
-
130
-
131
-
132
-
133
-
134
-
135
-
136
-
137
-
138
-
139
-
140
-
141
-
142
-
143
-
144
-
145
-
146
-
147
-
148
-
149
-
150
-
151
-
152
-
153
-
154
-
155
-
156
-
157
-
158
-
159
-
160
-
161
-
162
-
163
-
164
-
165
-
166
-
167
-
168
-
169
-
170
-
171
-
172
-
173
-
174
-
175
-
176
-
177
-
178
-
179
-
180
-
181
-
182
-
183
-
184
-
185
-
186
-
187
-
188
-
189
-
190
-
191
-
192
-
193
-
194
-
195
-
196
-
197
-
198
-
199
-
200
-
201
-
202
-
203
-
204
-
205
-
206
-
207
-
208
-
209
-
210
-
211
-
212
-
213
-
214
-
215
-
216
-
217
-
218
-
219
-
220
-
221
-
222
-
223
-
224
-
225
-
226
-
227
-
228
-
229
-
230
-
231
-
232
-
233
-
234
-
235
-
236
-
237
-
238
-
239
-
240
-
241
-
242
-
243
-
244
-
245
-
246
-
247
-
248
-
249
-
250
-
251
-
252
-
253
-
254
-
255
-
256
-
257
-
258
-
259
-
260
-
261
-
262
-
263
-
264
-
265
-
266
-
267
-
268
-
269
-
270
-
271
-
272
-
273
-
274
-
275
-
276
-
277
-
278
-
279
-
280
-
281
-
282
-
283
-
284
 |
 |
112 Bank of America 2013
We use interest rate derivative instruments to hedge the
variability in the cash flows of our assets and liabilities and other
forecasted transactions (collectively referred to as cash flow
hedges). The net losses on both open and terminated cash flow
hedge derivative instruments recorded in accumulated OCI, net-
of-tax, were $2.3 billion and $2.9 billion at December 31, 2013
and 2012. These net losses are expected to be reclassified into
earnings in the same period as the hedged cash flows affect
earnings and will decrease income or increase expense on the
respective hedged cash flows. Assuming no change in open cash
flow derivative hedge positions and no changes in prices or interest
rates beyond what is implied in forward yield curves at
December 31, 2013, the pre-tax net losses are expected to be
reclassified into earnings as follows: $784 million, or 22 percent
within the next year, 58 percent in years two through five, and 14
percent in years six through ten, with the remaining six percent
thereafter. For more information on derivatives designated as cash
flow hedges, see Note 2 – Derivatives to the Consolidated Financial
Statements.
We hedge our net investment in non-U.S. operations determined
to have functional currencies other than the U.S. dollar using
forward foreign exchange contracts that typically settle in less than
180 days, cross-currency basis swaps and foreign exchange
options. We recorded net after-tax losses on derivatives in
accumulated OCI associated with net investment hedges which
were offset by gains on our net investments in consolidated non-
U.S. entities at December 31, 2013.
Mortgage Banking Risk Management
We originate, fund and service mortgage loans, which subject us
to credit, liquidity and interest rate risks, among others. We
determine whether loans will be HFI or held-for-sale at the time of
commitment and manage credit and liquidity risks by selling or
securitizing a portion of the loans we originate.
Interest rate risk and market risk can be substantial in the
mortgage business. Fluctuations in interest rates drive consumer
demand for new mortgages and the level of refinancing activity,
which in turn affects total origination and servicing income.
Hedging the various sources of interest rate risk in mortgage
banking is a complex process that requires complex modeling and
ongoing monitoring. Typically, an increase in mortgage interest
rates will lead to a decrease in mortgage originations and related
fees. IRLCs and the related residential first mortgage LHFS are
subject to interest rate risk between the date of the IRLC and the
date the loans are sold to the secondary market, as an increase
in mortgage interest rates will typically lead to a decrease in the
value of these instruments. To hedge interest rate risk and certain
market risks of IRLCs and residential first mortgage LHFS, we
utilize forward loan sale commitments and other derivative
instruments including purchased options. At December 31, 2013
and 2012, the notional amounts of derivatives economically
hedging the IRLCs and residential first mortgage LHFS were $7.9
billion and $31.1 billion.
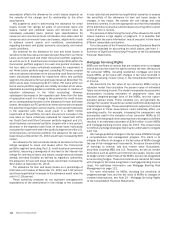
MSRs are nonfinancial assets created when the underlying
mortgage loan is sold to investors and we retain the right to service
the loan. Typically, an increase in mortgage rates will lead to an
increase in the value of the MSRs driven by lower prepayment
expectations. We use certain derivatives such as interest rate
options, interest rate swaps, forward settlement contracts and
Eurodollar futures, as well as principal-only and interest-only MBS
and U.S. Treasuries to hedge interest rate and certain other market
risks of MSRs. The fair value and notional amounts of the derivative
contracts and the fair value of securities hedging the MSRs were
$(2.9) billion, $1.8 trillion and $2.5 billion at December 31, 2013
and $2.3 billion, $1.6 trillion and $2.3 billion at December 31,
2012. In 2013, we recorded in mortgage banking income losses
of $1.1 billion related to the change in fair value of the derivative
contracts and other securities used to hedge the market risks of
the MSRs compared to gains of $2.3 billion for 2012. For more
information on MSRs, see Note 23 – Mortgage Servicing Rights to
the Consolidated Financial Statements and for more information
on mortgage banking income, see CRES on page 36.
Compliance Risk Management
The Global Compliance organization is responsible for overseeing
compliance risk, which is the risk of legal or regulatory sanctions,
material financial loss or damage to the reputation of the
Corporation in the event of the failure of the Corporation to comply
with requirements of applicable banking and financial services
laws, rules and regulations, related self-regulatory organization
standards, and codes of conduct. Compliance is at the core of the
Corporation’s culture and is a key component of risk management
discipline.
The Global Compliance Framework, an addendum to our Risk
Framework, details the high-level requirements of the global
compliance program in one comprehensive document. The Global
Compliance Framework also clearly defines roles and
responsibilities and is supported by policies that articulate
detailed requirements for implementation and execution of the
global compliance program. As such, the Global Compliance
Framework is designed to support responsible, well-informed
compliance risk management that incorporates an ongoing,
disciplined approach to proactive planning, oversight, escalation
and decision making across the Corporation.
The Global Compliance Framework also provides an outline for
senior management and the Board, and/or appropriate Board-level
committees, such as the Audit Committee, to oversee the
Corporation’s compliance risk management. The Board provides
oversight of compliance risks through its Audit Committee.
Operational Risk Management
The Corporation defines operational risk as the risk of loss
resulting from inadequate or failed internal processes, people and
systems or from external events. Operational risk may occur
anywhere in the Corporation, including outsourced business
processes, and is not limited to operations functions. Its effects
may extend beyond financial losses. Operational risk includes legal
risk. Successful operational risk management is particularly
important to diversified financial services companies because of
the nature, volume and complexity of the financial services
business. Operational risk is a significant component in the
calculation of total risk-weighted assets used in the Basel 3 capital
determination. For more information on Basel 3, see Capital
Management – Regulatory Capital Changes on page 64.
We approach operational risk management from two
perspectives to manage operational risk within the structure of
the Corporation: (1) at the enterprise level to provide independent,
integrated management of operational risk across the
organization, and (2) at the business and enterprise control
function levels to address operational risk in revenue producing
and non-revenue producing units. The Operational Risk
Management Program addresses the overarching processes for