Bank of America 2013 Annual Report Download - page 183
Download and view the complete annual report
Please find page 183 of the 2013 Bank of America annual report below. You can navigate through the pages in the report by either clicking on the pages listed below, or by using the keyword search tool below to find specific information within the annual report.-
 1
1 -
2
-
3
-
4
-
5
-
6
-
7
-
8
-
9
-
10
-
11
-
12
-
13
-
14
-
15
-
16
-
17
-
18
-
19
-
20
-
21
-
22
-
23
-
24
-
25
-
26
-
27
-
28
-
29
-
30
-
31
-
32
-
33
-
34
-
35
-
36
-
37
-
38
-
39
-
40
-
41
-
42
-
43
-
44
-
45
-
46
-
47
-
48
-
49
-
50
-
51
-
52
-
53
-
54
-
55
-
56
-
57
-
58
-
59
-
60
-
61
-
62
-
63
-
64
-
65
-
66
-
67
-
68
-
69
-
70
-
71
-
72
-
73
-
74
-
75
-
76
-
77
-
78
-
79
-
80
-
81
-
82
-
83
-
84
-
85
-
86
-
87
-
88
-
89
-
90
-
91
-
92
-
93
-
94
-
95
-
96
-
97
-
98
-
99
-
100
-
101
-
102
-
103
-
104
-
105
-
106
-
107
-
108
-
109
-
110
-
111
-
112
-
113
-
114
-
115
-
116
-
117
-
118
-
119
-
120
-
121
-
122
-
123
-
124
-
125
-
126
-
127
-
128
-
129
-
130
-
131
-
132
-
133
-
134
-
135
-
136
-
137
-
138
-
139
-
140
-
141
-
142
-
143
-
144
-
145
-
146
-
147
-
148
-
149
-
150
-
151
-
152
-
153
-
154
-
155
-
156
-
157
-
158
-
159
-
160
-
161
-
162
-
163
-
164
-
165
-
166
-
167
-
168
-
169
-
170
-
171
-
172
-
 173
173 -
 174
174 -
 175
175 -
 176
176 -
 177
177 -
 178
178 -
 179
179 -
 180
180 -
 181
181 -
 182
182 -
 183
183 -
 184
184 -
 185
185 -
 186
186 -
 187
187 -
 188
188 -
 189
189 -
 190
190 -
 191
191 -
 192
192 -
 193
193 -
194
-
195
-
196
-
197
-
198
-
199
-
200
-
201
-
202
-
203
-
204
-
205
-
206
-
207
-
208
-
209
-
210
-
211
-
212
-
213
-
214
-
215
-
216
-
217
-
218
-
219
-
220
-
221
-
222
-
223
-
224
-
225
-
226
-
227
-
228
-
229
-
230
-
231
-
232
-
233
-
234
-
235
-
236
-
237
-
238
-
239
-
240
-
241
-
242
-
243
-
244
-
245
-
246
-
247
-
248
-
249
-
250
-
251
-
252
-
253
-
254
-
255
-
256
-
257
-
258
-
259
-
260
-
261
-
262
-
263
-
264
-
265
-
266
-
267
-
268
-
269
-
270
-
271
-
272
-
273
-
274
-
275
-
276
-
277
-
278
-
279
-
280
-
281
-
282
-
283
-
284
 |
 |

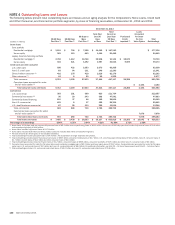
Bank of America 2013 181
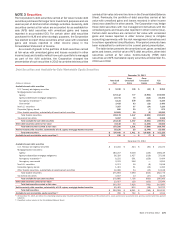
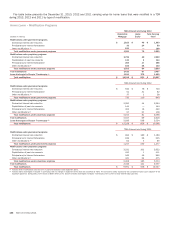
December 31, 2012
(Dollars in millions)
30-59 Days
Past Due (1)
60-89 Days
Past Due (1)
90 Days or
More
Past Due (2)
Total Past
Due 30
Days
or More
Tota l
Current or
Less Than
30 Days
Past Due (3)
Purchased
Credit-
impaired (4)
Loans
Accounted
for Under
the Fair
Value Option
Total
Outstandings
Home loans
Core portfolio
Residential mortgage (5) $ 2,274 $ 806 $ 6,227 $ 9,307 $ 160,809 $ 170,116
Home equity 273 146 591 1,010 59,841 60,851
Legacy Assets & Servicing portfolio
Residential mortgage (6) 2,938 1,714 26,728 31,380 33,982 $ 17,451 82,813
Home equity 608 357 1,444 2,409 36,213 8,667 47,289
Credit card and other consumer
U.S. credit card 729 582 1,437 2,748 92,087 94,835
Non-U.S. credit card 106 85 212 403 11,294 11,697
Direct/Indirect consumer (7) 569 239 573 1,381 81,824 83,205
Other consumer (8) 48 19 4 71 1,557 1,628
Total consumer 7,545 3,948 37,216 48,709 477,607 26,118 552,434
Consumer loans accounted for under
the fair value option (9) $ 1,005 1,005
Total consumer loans and leases 7,545 3,948 37,216 48,709 477,607 26,118 1,005 553,439
Commercial
U.S. commercial 323 133 639 1,095 196,031 197,126
Commercial real estate (10) 79 144 983 1,206 37,431 38,637
Commercial lease financing 84 79 30 193 23,650 23,843
Non-U.S. commercial 2 — — 2 74,182 74,184
U.S. small business commercial 101 75 168 344 12,249 12,593
Total commercial 589 431 1,820 2,840 343,543 346,383
Commercial loans accounted for under
the fair value option (9) 7,997 7,997
Total commercial loans and leases 589 431 1,820 2,840 343,543 7,997 354,380
Total loans and leases $ 8,134 $ 4,379 $ 39,036 $ 51,549 $ 821,150 $ 26,118 $ 9,002 $ 907,819
Percentage of outstandings 0.90% 0.48% 4.30% 5.68% 90.45% 2.88% 0.99%
(1) Home loans 30-59 days past due includes fully-insured loans of $2.3 billion and nonperforming loans of $702 million. Home loans 60-89 days past due includes fully-insured loans of $1.3 billion
and nonperforming loans of $558 million.
(2) Home loans includes fully-insured loans of $22.2 billion.
(3) Home loans includes $5.5 billion and direct/indirect consumer includes $63 million of nonperforming loans.
(4) PCI loan amounts are shown gross of the valuation allowance.
(5) Total outstandings includes non-U.S. residential mortgage loans of $93 million.
(6) Total outstandings includes pay option loans of $6.7 billion. The Corporation no longer originates this product.
(7) Total outstandings includes dealer financial services loans of $35.9 billion, consumer lending loans of $4.7 billion, U.S. securities-based lending loans of $28.3 billion, non-U.S. consumer loans of
$8.3 billion, student loans of $4.8 billion and other consumer loans of $1.2 billion.
(8) Total outstandings includes consumer finance loans of $1.4 billion, consumer leases of $34 million, consumer overdrafts of $177 million and other non-U.S. consumer loans of $5 million.
(9) Consumer loans accounted for under the fair value option were residential mortgage loans of $1.0 billion. Commercial loans accounted for under the fair value option were U.S. commercial loans
of $2.3 billion and non-U.S. commercial loans of $5.7 billion. For additional information, see Note 20 – Fair Value Measurements and Note 21 – Fair Value Option.
(10) Total outstandings includes U.S. commercial real estate loans of $37.2 billion and non-U.S. commercial real estate loans of $1.5 billion.