Bank of America 2013 Annual Report Download - page 137
Download and view the complete annual report
Please find page 137 of the 2013 Bank of America annual report below. You can navigate through the pages in the report by either clicking on the pages listed below, or by using the keyword search tool below to find specific information within the annual report.-
 1
1 -
2
-
3
-
4
-
5
-
6
-
7
-
8
-
9
-
10
-
11
-
12
-
13
-
14
-
15
-
16
-
17
-
18
-
19
-
20
-
21
-
22
-
23
-
24
-
25
-
26
-
27
-
28
-
29
-
30
-
31
-
32
-
33
-
34
-
35
-
36
-
37
-
38
-
39
-
40
-
41
-
42
-
43
-
44
-
45
-
46
-
47
-
48
-
49
-
50
-
51
-
52
-
53
-
54
-
55
-
56
-
57
-
58
-
59
-
60
-
61
-
62
-
63
-
64
-
65
-
66
-
67
-
68
-
69
-
70
-
71
-
72
-
73
-
74
-
75
-
76
-
77
-
78
-
79
-
80
-
81
-
82
-
83
-
84
-
85
-
86
-
87
-
88
-
89
-
90
-
91
-
92
-
93
-
94
-
95
-
96
-
97
-
98
-
99
-
100
-
101
-
102
-
103
-
104
-
105
-
106
-
107
-
108
-
109
-
110
-
111
-
112
-
113
-
114
-
115
-
116
-
117
-
118
-
119
-
120
-
121
-
122
-
123
-
124
-
125
-
126
-
 127
127 -
 128
128 -
 129
129 -
 130
130 -
 131
131 -
 132
132 -
 133
133 -
 134
134 -
 135
135 -
 136
136 -
 137
137 -
 138
138 -
 139
139 -
 140
140 -
 141
141 -
 142
142 -
 143
143 -
 144
144 -
 145
145 -
 146
146 -
 147
147 -
148
-
149
-
150
-
151
-
152
-
153
-
154
-
155
-
156
-
157
-
158
-
159
-
160
-
161
-
162
-
163
-
164
-
165
-
166
-
167
-
168
-
169
-
170
-
171
-
172
-
173
-
174
-
175
-
176
-
177
-
178
-
179
-
180
-
181
-
182
-
183
-
184
-
185
-
186
-
187
-
188
-
189
-
190
-
191
-
192
-
193
-
194
-
195
-
196
-
197
-
198
-
199
-
200
-
201
-
202
-
203
-
204
-
205
-
206
-
207
-
208
-
209
-
210
-
211
-
212
-
213
-
214
-
215
-
216
-
217
-
218
-
219
-
220
-
221
-
222
-
223
-
224
-
225
-
226
-
227
-
228
-
229
-
230
-
231
-
232
-
233
-
234
-
235
-
236
-
237
-
238
-
239
-
240
-
241
-
242
-
243
-
244
-
245
-
246
-
247
-
248
-
249
-
250
-
251
-
252
-
253
-
254
-
255
-
256
-
257
-
258
-
259
-
260
-
261
-
262
-
263
-
264
-
265
-
266
-
267
-
268
-
269
-
270
-
271
-
272
-
273
-
274
-
275
-
276
-
277
-
278
-
279
-
280
-
281
-
282
-
283
-
284
 |
 |

Bank of America 2013 135
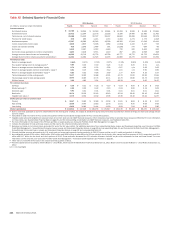
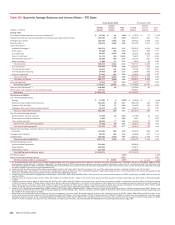
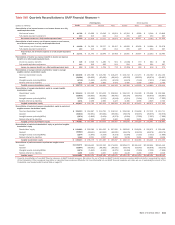
Table XII Selected Quarterly Financial Data (continued)
2013 Quarters 2012 Quarters
(Dollars in millions) Fourth Third Second First Fourth Third Second First
Average balance sheet
Total loans and leases $ 929,777 $ 923,978 $ 914,234 $ 906,259 $ 893,166 $ 888,859 $ 899,498 $ 913,722
Total assets 2,134,875 2,123,430 2,184,610 2,212,430 2,210,365 2,173,312 2,194,563 2,187,174
Total deposits 1,112,674 1,090,611 1,079,956 1,075,280 1,078,076 1,049,697 1,032,888 1,030,112
Long-term debt 251,055 258,717 270,198 273,999 277,894 291,684 333,173 363,518
Common shareholders’ equity 220,088 216,766 218,790 218,225 219,744 217,273 216,782 214,150
Total shareholders’ equity 233,415 230,392 235,063 236,995 238,512 236,039 235,558 232,566
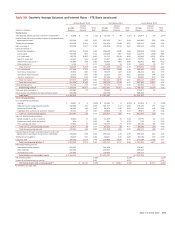
Asset quality (4)
Allowance for credit losses (5) $ 17,912 $ 19,912 $ 21,709 $ 22,927 $ 24,692 $ 26,751 $ 30,862 $ 32,862
Nonperforming loans, leases and foreclosed properties (6) 17,772 20,028 21,280 22,842 23,555 24,925 25,377 27,790
Allowance for loan and lease losses as a percentage of total loans
and leases outstanding (6) 1.90% 2.10% 2.33% 2.49% 2.69% 2.96% 3.43% 3.61%
Allowance for loan and lease losses as a percentage of total
nonperforming loans and leases (6) 102 100 103 102 107 111 127 126
Allowance for loan and lease losses as a percentage of total
nonperforming loans and leases, excluding the PCI loan portfolio (6) 87 84 84 82 82 81 90 91
Amounts included in allowance that are excluded from nonperforming
loans and leases (7) $ 7,680 $ 8,972 $ 9,919 $ 10,690 $ 12,021 $ 13,978 $ 16,327 $ 17,006
Allowance as a percentage of total nonperforming loans and leases,
excluding amounts included in the allowance that are excluded from
nonperforming loans and leases (7) 57% 54% 55% 53% 54% 52% 59% 60%
Net charge-offs (8) $ 1,582 $ 1,687 $ 2,111 $ 2,517 $ 3,104 $ 4,122 $ 3,626 $ 4,056
Annualized net charge-offs as a percentage of average loans and
leases outstanding (6, 8) 0.68% 0.73% 0.94% 1.14% 1.40% 1.86% 1.64% 1.80%
Annualized net charge-offs as a percentage of average loans and
leases outstanding, excluding the PCI loan portfolio (6) 0.70 0.75 0.97 1.18 1.44 1.93 1.69 1.87
Annualized net charge-offs and PCI write-offs as a percentage of
average loans and leases outstanding (6, 9) 1.00 0.92 1.07 1.52 1.90 2.63 1.64 1.80
Nonperforming loans and leases as a percentage of total loans and
leases outstanding (6) 1.87 2.10 2.26 2.44 2.52 2.68 2.70 2.85
Nonperforming loans, leases and foreclosed properties as a
percentage of total loans, leases and foreclosed properties (6) 1.93 2.17 2.33 2.53 2.62 2.81 2.87 3.10
Ratio of the allowance for loan and lease losses at period end to
annualized net charge-offs (8) 2.78 2.90 2.51 2.20 1.96 1.60 2.08 1.97
Ratio of the allowance for loan and lease losses at period end to
annualized net charge-offs, excluding the PCI loan portfolio 2.38 2.42 2.04 1.76 1.51 1.17 1.46 1.43
Ratio of the allowance for loan and lease losses at period end to
annualized net charge-offs and PCI write-offs (9) 1.89 2.30 2.18 1.65 1.44 1.13 2.08 1.97
Capital ratios at period end (10)
Risk-based capital:
Tier 1 common capital 11.19% 11.08% 10.83% 10.49% 11.06% 11.41% 11.24% 10.78%
Tier 1 capital 12.44 12.33 12.16 12.22 12.89 13.64 13.80 13.37
Total capital 15.44 15.36 15.27 15.50 16.31 17.16 17.51 17.49
Tier 1 leverage 7.86 7.79 7.49 7.49 7.37 7.84 7.84 7.79
Tangible equity (3) 7.86 7.73 7.67 7.78 7.62 7.85 7.73 7.48
Tangible common equity (3) 7.20 7.08 6.98 6.88 6.74 6.95 6.83 6.58
For footnotes see page 134.