Bank of America 2013 Annual Report Download - page 74
Download and view the complete annual report
Please find page 74 of the 2013 Bank of America annual report below. You can navigate through the pages in the report by either clicking on the pages listed below, or by using the keyword search tool below to find specific information within the annual report.-
 1
1 -
2
-
3
-
4
-
5
-
6
-
7
-
8
-
9
-
10
-
11
-
12
-
13
-
14
-
15
-
16
-
17
-
18
-
19
-
20
-
21
-
22
-
23
-
24
-
25
-
26
-
27
-
28
-
29
-
30
-
31
-
32
-
33
-
34
-
35
-
36
-
37
-
38
-
39
-
40
-
41
-
42
-
43
-
44
-
45
-
46
-
47
-
48
-
49
-
50
-
51
-
52
-
53
-
54
-
55
-
56
-
57
-
58
-
59
-
60
-
61
-
62
-
63
-
 64
64 -
 65
65 -
 66
66 -
 67
67 -
 68
68 -
 69
69 -
 70
70 -
 71
71 -
 72
72 -
 73
73 -
 74
74 -
 75
75 -
 76
76 -
 77
77 -
 78
78 -
 79
79 -
 80
80 -
 81
81 -
 82
82 -
 83
83 -
 84
84 -
85
-
86
-
87
-
88
-
89
-
90
-
91
-
92
-
93
-
94
-
95
-
96
-
97
-
98
-
99
-
100
-
101
-
102
-
103
-
104
-
105
-
106
-
107
-
108
-
109
-
110
-
111
-
112
-
113
-
114
-
115
-
116
-
117
-
118
-
119
-
120
-
121
-
122
-
123
-
124
-
125
-
126
-
127
-
128
-
129
-
130
-
131
-
132
-
133
-
134
-
135
-
136
-
137
-
138
-
139
-
140
-
141
-
142
-
143
-
144
-
145
-
146
-
147
-
148
-
149
-
150
-
151
-
152
-
153
-
154
-
155
-
156
-
157
-
158
-
159
-
160
-
161
-
162
-
163
-
164
-
165
-
166
-
167
-
168
-
169
-
170
-
171
-
172
-
173
-
174
-
175
-
176
-
177
-
178
-
179
-
180
-
181
-
182
-
183
-
184
-
185
-
186
-
187
-
188
-
189
-
190
-
191
-
192
-
193
-
194
-
195
-
196
-
197
-
198
-
199
-
200
-
201
-
202
-
203
-
204
-
205
-
206
-
207
-
208
-
209
-
210
-
211
-
212
-
213
-
214
-
215
-
216
-
217
-
218
-
219
-
220
-
221
-
222
-
223
-
224
-
225
-
226
-
227
-
228
-
229
-
230
-
231
-
232
-
233
-
234
-
235
-
236
-
237
-
238
-
239
-
240
-
241
-
242
-
243
-
244
-
245
-
246
-
247
-
248
-
249
-
250
-
251
-
252
-
253
-
254
-
255
-
256
-
257
-
258
-
259
-
260
-
261
-
262
-
263
-
264
-
265
-
266
-
267
-
268
-
269
-
270
-
271
-
272
-
273
-
274
-
275
-
276
-
277
-
278
-
279
-
280
-
281
-
282
-
283
-
284
 |
 |

72 Bank of America 2013
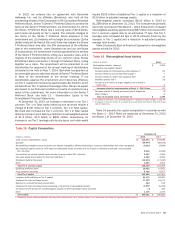
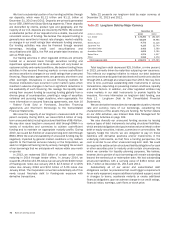
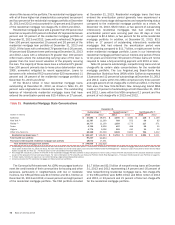
Table 24 presents the amount of additional collateral
contractually required by derivative contracts and other trading
agreements at December 31, 2013 if the rating agencies had
downgraded their long-term senior debt ratings for the Corporation
or certain subsidiaries by one incremental notch and by an
additional second incremental notch.
Table 24 Additional Collateral Required to be Posted
Upon Downgrade
December 31, 2013
(Dollars in millions)
One
incremental
notch
Second
incremental
notch
Bank of America Corporation $ 1,302 $ 4,101
Bank of America, N.A. and subsidiaries (1) 881 3,039
(1) Included in Bank of America Corporation collateral requirements in this table.
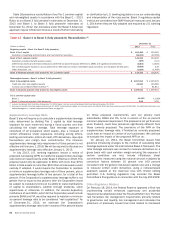
Table 25 presents the derivative liability that would be subject
to unilateral termination by counterparties and the amounts of
collateral that would have been posted at December 31, 2013, if
the rating agencies had downgraded their long-term senior debt
ratings for the Corporation or certain subsidiaries by one
incremental notch and by an additional second incremental notch.
Table 25 Derivative Liability Subject to Unilateral
Termination Upon Downgrade
December 31, 2013
(Dollars in millions)
One
incremental
notch
Second
incremental
notch
Derivative liability $ 927 $ 1,878
Collateral posted 733 1,467
While certain potential impacts are contractual and
quantifiable, the full scope of the consequences of a credit ratings
downgrade to a financial institution is inherently uncertain, as it
depends upon numerous dynamic, complex and inter-related
factors and assumptions, including whether any downgrade of a
company’s long-term credit ratings precipitates downgrades to its
short-term credit ratings, and assumptions about the potential
behaviors of various customers, investors and counterparties. For
more information on potential impacts of credit rating downgrades,
see Liquidity Risk – Time to Required Funding and Stress Modeling
on page 68.
For more information on the additional collateral and
termination payments that could be required in connection with
certain OTC derivative contracts and other trading agreements as
a result of such a credit rating downgrade, see Note 2 – Derivatives
to the Consolidated Financial Statements and Item 1A. Risk
Factors of this Annual Report on Form 10-K.
On October 15, 2013, Fitch placed its AAA long-term and F1+
short-term sovereign credit rating on the U.S. government on rating
watch negative. On July 18, 2013, Moody’s revised its outlook on
the U.S. government to stable from negative and affirmed its Aaa
long-term sovereign credit rating on the U.S. government. On June
10, 2013, S&P affirmed its AA+ long-term and A-1+ short-term
sovereign credit rating on the U.S. government, as the outlook on
the long-term credit rating was revised to stable from negative.
Credit Risk Management
Credit quality improved during 2013 due in part to improving
economic conditions. In addition, our proactive credit risk
management activities positively impacted the credit portfolio as
charge-offs and delinquencies continued to improve. For additional
information, see Executive Summary – 2013 Economic and
Business Environment on page 20.
Credit risk is the risk of loss arising from the inability or failure
of a borrower or counterparty to meet its obligations. Credit risk
can also arise from operational failures that result in an erroneous
advance, commitment or investment of funds. We define the credit
exposure to a borrower or counterparty as the loss potential arising
from all product classifications including loans and leases, deposit
overdrafts, derivatives, assets held-for-sale and unfunded lending
commitments which include loan commitments, letters of credit
and financial guarantees. Derivative positions are recorded at fair
value and assets held-for-sale are recorded at either fair value or
the lower of cost or fair value. Certain loans and unfunded
commitments are accounted for under the fair value option. Credit
risk for categories of assets carried at fair value is not accounted
for as part of the allowance for credit losses but as part of the fair
value adjustments recorded in earnings. For derivative positions,
our credit risk is measured as the net cost in the event the
counterparties with contracts in which we are in a gain position
fail to perform under the terms of those contracts. We use the
current fair value to represent credit exposure without giving
consideration to future mark-to-market changes. The credit risk
amounts take into consideration the effects of legally enforceable
master netting agreements and cash collateral. Our consumer and
commercial credit extension and review procedures encompass
funded and unfunded credit exposures. For more information on
derivative and credit extension commitments, see Note 2 –
Derivatives and Note 12 – Commitments and Contingencies to the
Consolidated Financial Statements.
We manage credit risk based on the risk profile of the borrower
or counterparty, repayment sources, the nature of underlying
collateral, and other support given current events, conditions and
expectations. We classify our portfolios as either consumer or
commercial and monitor credit risk in each as discussed below.
We proactively refine our underwriting and credit management
practices as well as credit standards to meet the changing
economic environment. To actively mitigate losses and enhance
customer support in our consumer businesses, we have in place
collection programs and loan modification and customer
assistance infrastructures. We utilize a number of actions to
mitigate losses in the commercial businesses including increasing
the frequency and intensity of portfolio monitoring, hedging activity
and our practice of transferring management of deteriorating
commercial exposures to independent special asset officers as
credits enter criticized categories.
We have non-U.S. exposure largely in Europe and Asia Pacific.
Our exposure to certain European countries, including Greece,
Ireland, Italy, Portugal and Spain, has experienced varying degrees
of financial stress. For more information on our exposures and
related risks in non-U.S. countries, see Non-U.S. Portfolio on page
96 and Item 1A. Risk Factors of this Annual Report on Form 10-
K.