Bank of America 2013 Annual Report Download - page 153
Download and view the complete annual report
Please find page 153 of the 2013 Bank of America annual report below. You can navigate through the pages in the report by either clicking on the pages listed below, or by using the keyword search tool below to find specific information within the annual report.-
 1
1 -
2
-
3
-
4
-
5
-
6
-
7
-
8
-
9
-
10
-
11
-
12
-
13
-
14
-
15
-
16
-
17
-
18
-
19
-
20
-
21
-
22
-
23
-
24
-
25
-
26
-
27
-
28
-
29
-
30
-
31
-
32
-
33
-
34
-
35
-
36
-
37
-
38
-
39
-
40
-
41
-
42
-
43
-
44
-
45
-
46
-
47
-
48
-
49
-
50
-
51
-
52
-
53
-
54
-
55
-
56
-
57
-
58
-
59
-
60
-
61
-
62
-
63
-
64
-
65
-
66
-
67
-
68
-
69
-
70
-
71
-
72
-
73
-
74
-
75
-
76
-
77
-
78
-
79
-
80
-
81
-
82
-
83
-
84
-
85
-
86
-
87
-
88
-
89
-
90
-
91
-
92
-
93
-
94
-
95
-
96
-
97
-
98
-
99
-
100
-
101
-
102
-
103
-
104
-
105
-
106
-
107
-
108
-
109
-
110
-
111
-
112
-
113
-
114
-
115
-
116
-
117
-
118
-
119
-
120
-
121
-
122
-
123
-
124
-
125
-
126
-
127
-
128
-
129
-
130
-
131
-
132
-
133
-
134
-
135
-
136
-
137
-
138
-
139
-
140
-
141
-
142
-
 143
143 -
 144
144 -
 145
145 -
 146
146 -
 147
147 -
 148
148 -
 149
149 -
 150
150 -
 151
151 -
 152
152 -
 153
153 -
 154
154 -
 155
155 -
 156
156 -
 157
157 -
 158
158 -
 159
159 -
 160
160 -
 161
161 -
 162
162 -
 163
163 -
164
-
165
-
166
-
167
-
168
-
169
-
170
-
171
-
172
-
173
-
174
-
175
-
176
-
177
-
178
-
179
-
180
-
181
-
182
-
183
-
184
-
185
-
186
-
187
-
188
-
189
-
190
-
191
-
192
-
193
-
194
-
195
-
196
-
197
-
198
-
199
-
200
-
201
-
202
-
203
-
204
-
205
-
206
-
207
-
208
-
209
-
210
-
211
-
212
-
213
-
214
-
215
-
216
-
217
-
218
-
219
-
220
-
221
-
222
-
223
-
224
-
225
-
226
-
227
-
228
-
229
-
230
-
231
-
232
-
233
-
234
-
235
-
236
-
237
-
238
-
239
-
240
-
241
-
242
-
243
-
244
-
245
-
246
-
247
-
248
-
249
-
250
-
251
-
252
-
253
-
254
-
255
-
256
-
257
-
258
-
259
-
260
-
261
-
262
-
263
-
264
-
265
-
266
-
267
-
268
-
269
-
270
-
271
-
272
-
273
-
274
-
275
-
276
-
277
-
278
-
279
-
280
-
281
-
282
-
283
-
284
 |
 |

Bank of America 2013 151
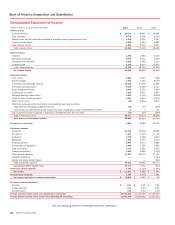
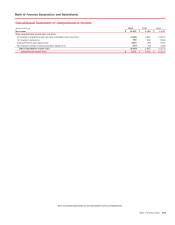
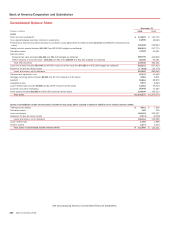
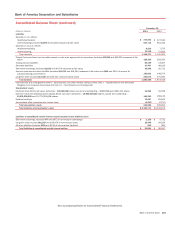
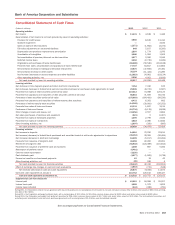
Bank of America Corporation and Subsidiaries
Consolidated Balance Sheet (continued)
December 31
(Dollars in millions) 2013 2012
Liabilities
Deposits in U.S. offices:
Noninterest-bearing $ 373,092 $ 372,546
Interest-bearing (includes $1,899 and $2,262 measured at fair value) 667,714 654,332
Deposits in non-U.S. offices:
Noninterest-bearing 8,233 7,573
Interest-bearing 70,232 70,810
Total deposits 1,119,271 1,105,261
Federal funds purchased and securities loaned or sold under agreements to repurchase (includes $33,684 and $42,639 measured at fair
value) 198,106 293,259
Trading account liabilities 83,469 73,587
Derivative liabilities 37,407 46,016
Short-term borrowings (includes $1,520 and $4,074 measured at fair value) 45,999 30,731
Accrued expenses and other liabilities (includes $11,233 and $16,594 measured at fair value and $484 and $513 of reserve for
unfunded lending commitments) 135,662 148,579
Long-term debt (includes $47,035 and $49,161 measured at fair value) 249,674 275,585
Total liabilities 1,869,588 1,973,018
Commitments and contingencies (Note 6 – Securitizations and Other Variable Interest Entities, Note 7 – Representations and Warranties
Obligations and Corporate Guarantees and Note 12 – Commitments and Contingencies)
Shareholders’ equity
Preferred stock, $0.01 par value; authorized – 100,000,000 shares; issued and outstanding – 3,407,790 and 3,685,410 shares 13,352 18,768
Common stock and additional paid-in capital, $0.01 par value; authorized – 12,800,000,000 shares; issued and outstanding –
10,591,808,296 and 10,778,263,628 shares 155,293 158,142
Retained earnings 72,497 62,843
Accumulated other comprehensive income (loss) (8,457)(2,797)
Total shareholders’ equity 232,685 236,956
Total liabilities and shareholders’ equity $ 2,102,273 $ 2,209,974
Liabilities of consolidated variable interest entities included in total liabilities above
Short-term borrowings (includes $77 and $872 of non-recourse borrowings) $ 1,150 $ 3,731
Long-term debt (includes $16,209 and $29,476 of non-recourse debt) 19,448 34,256
All other liabilities (includes $138 and $149 of non-recourse liabilities) 253 360
Total liabilities of consolidated variable interest entities $ 20,851 $ 38,347
See accompanying Notes to Consolidated Financial Statements.