Bank of America 2013 Annual Report Download - page 94
Download and view the complete annual report
Please find page 94 of the 2013 Bank of America annual report below. You can navigate through the pages in the report by either clicking on the pages listed below, or by using the keyword search tool below to find specific information within the annual report.-
 1
1 -
2
-
3
-
4
-
5
-
6
-
7
-
8
-
9
-
10
-
11
-
12
-
13
-
14
-
15
-
16
-
17
-
18
-
19
-
20
-
21
-
22
-
23
-
24
-
25
-
26
-
27
-
28
-
29
-
30
-
31
-
32
-
33
-
34
-
35
-
36
-
37
-
38
-
39
-
40
-
41
-
42
-
43
-
44
-
45
-
46
-
47
-
48
-
49
-
50
-
51
-
52
-
53
-
54
-
55
-
56
-
57
-
58
-
59
-
60
-
61
-
62
-
63
-
64
-
65
-
66
-
67
-
68
-
69
-
70
-
71
-
72
-
73
-
74
-
75
-
76
-
77
-
78
-
79
-
80
-
81
-
82
-
83
-
 84
84 -
 85
85 -
 86
86 -
 87
87 -
 88
88 -
 89
89 -
 90
90 -
 91
91 -
 92
92 -
 93
93 -
 94
94 -
 95
95 -
 96
96 -
 97
97 -
 98
98 -
 99
99 -
 100
100 -
 101
101 -
 102
102 -
 103
103 -
 104
104 -
105
-
106
-
107
-
108
-
109
-
110
-
111
-
112
-
113
-
114
-
115
-
116
-
117
-
118
-
119
-
120
-
121
-
122
-
123
-
124
-
125
-
126
-
127
-
128
-
129
-
130
-
131
-
132
-
133
-
134
-
135
-
136
-
137
-
138
-
139
-
140
-
141
-
142
-
143
-
144
-
145
-
146
-
147
-
148
-
149
-
150
-
151
-
152
-
153
-
154
-
155
-
156
-
157
-
158
-
159
-
160
-
161
-
162
-
163
-
164
-
165
-
166
-
167
-
168
-
169
-
170
-
171
-
172
-
173
-
174
-
175
-
176
-
177
-
178
-
179
-
180
-
181
-
182
-
183
-
184
-
185
-
186
-
187
-
188
-
189
-
190
-
191
-
192
-
193
-
194
-
195
-
196
-
197
-
198
-
199
-
200
-
201
-
202
-
203
-
204
-
205
-
206
-
207
-
208
-
209
-
210
-
211
-
212
-
213
-
214
-
215
-
216
-
217
-
218
-
219
-
220
-
221
-
222
-
223
-
224
-
225
-
226
-
227
-
228
-
229
-
230
-
231
-
232
-
233
-
234
-
235
-
236
-
237
-
238
-
239
-
240
-
241
-
242
-
243
-
244
-
245
-
246
-
247
-
248
-
249
-
250
-
251
-
252
-
253
-
254
-
255
-
256
-
257
-
258
-
259
-
260
-
261
-
262
-
263
-
264
-
265
-
266
-
267
-
268
-
269
-
270
-
271
-
272
-
273
-
274
-
275
-
276
-
277
-
278
-
279
-
280
-
281
-
282
-
283
-
284
 |
 |
92 Bank of America 2013
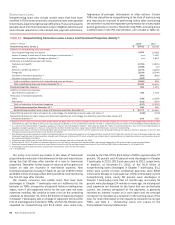
fund the construction and/or rehabilitation of commercial
properties. Reservable criticized construction and land
development loans totaled $431 million and $1.5 billion, and
nonperforming construction and land development loans and
foreclosed properties totaled $100 million and $730 million at
December 31, 2013 and 2012. During a property’s construction
phase, interest income is typically paid from interest reserves that
are established at the inception of the loan. As construction is
completed and the property is put into service, these interest
reserves are depleted and interest payments from operating cash
flows begin. We do not recognize interest income on nonperforming
loans regardless of the existence of an interest reserve.
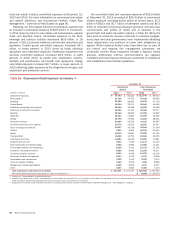
Non-U.S. Commercial
At December 31, 2013, 70 percent of the non-U.S. commercial
loan portfolio was managed in Global Banking and 30 percent in
Global Markets. Outstanding loans, excluding loans accounted for
under the fair value option, increased $15.3 billion in 2013
primarily due to increased demand from large corporate clients
and client financing activity. Net charge-offs increased $17 million
to $45 million in 2013. For more information on the non-U.S.
commercial portfolio, see Non-U.S. Portfolio on page 96.
U.S. Small Business Commercial
The U.S. small business commercial loan portfolio is comprised
of small business card loans and small business loans managed
in CBB. Credit card-related products were 43 percent and 45
percent of the U.S. small business commercial portfolio at
December 31, 2013 and 2012. Net charge-offs decreased $340
million to $359 million in 2013 driven by lower delinquencies and
bankruptcies resulting from an improvement in credit quality within
the small business loan portfolio, an improved economic
environment, a reduction in higher risk vintages and the impact of
higher credit quality originations. Of the U.S. small business
commercial net charge-offs, 73 percent were credit card-related
products in 2013 compared to 58 percent in 2012.
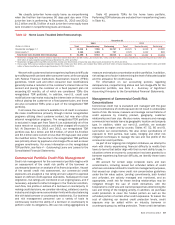
Commercial Loans Accounted for Under the Fair Value
Option
The portfolio of commercial loans accounted for under the fair
value option is managed primarily in Global Banking. Outstanding
commercial loans accounted for under the fair value option
decreased $119 million to an aggregate fair value of $7.9 billion
at December 31, 2013 primarily due to decreased corporate
borrowings under bank credit facilities. We recorded net gains of
$88 million in 2013 compared to $213 million in 2012 resulting
from changes in the fair value of the loan portfolio. These amounts
were primarily attributable to changes in instrument-specific credit
risk, were recorded in other income (loss) and do not reflect the
results of hedging activities.
In addition, unfunded lending commitments and letters of credit
accounted for under the fair value option had an aggregate fair
value of $354 million and $528 million at December 31, 2013
and 2012 which was recorded in accrued expenses and other
liabilities. The associated aggregate notional amount of unfunded
lending commitments and letters of credit accounted for under the
fair value option was $13.0 billion and $18.3 billion at
December 31, 2013 and 2012. We recorded net gains of $180
million from changes in the fair value of commitments and letters
of credit during 2013 compared to $704 million in 2012 resulting
from maturities and terminations at par value and changes in the
fair value of the loan portfolio. These amounts were primarily
attributable to changes in instrument-specific credit risk, were
recorded in other income (loss) and do not reflect the results of
hedging activities.
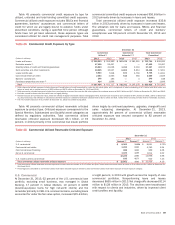
Nonperforming Commercial Loans, Leases and
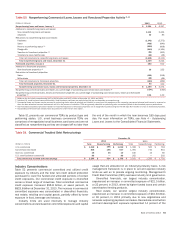
Foreclosed Properties Activity
Table 50 presents the nonperforming commercial loans, leases
and foreclosed properties activity during 2013 and 2012.
Nonperforming loans do not include loans accounted for under the
fair value option. During 2013, nonperforming commercial loans
and leases decreased $1.9 billion to $1.3 billion driven by
paydowns, charge-offs and sales outpacing new nonperforming
loans. Approximately 91 percent of commercial nonperforming
loans, leases and foreclosed properties were secured and
approximately 55 percent were contractually current. Commercial
nonperforming loans were carried at approximately 71 percent of
their unpaid principal balance before consideration of the
allowance for loan and lease losses as the carrying value of these
loans has been reduced to the estimated property value less costs
to sell.