Bank of America 2013 Annual Report Download - page 32
Download and view the complete annual report
Please find page 32 of the 2013 Bank of America annual report below. You can navigate through the pages in the report by either clicking on the pages listed below, or by using the keyword search tool below to find specific information within the annual report.-
 1
1 -
2
-
3
-
4
-
5
-
6
-
7
-
8
-
9
-
10
-
11
-
12
-
13
-
14
-
15
-
16
-
17
-
18
-
19
-
20
-
21
-
 22
22 -
 23
23 -
 24
24 -
 25
25 -
 26
26 -
 27
27 -
 28
28 -
 29
29 -
 30
30 -
 31
31 -
 32
32 -
 33
33 -
 34
34 -
 35
35 -
 36
36 -
 37
37 -
 38
38 -
 39
39 -
 40
40 -
 41
41 -
 42
42 -
43
-
44
-
45
-
46
-
47
-
48
-
49
-
50
-
51
-
52
-
53
-
54
-
55
-
56
-
57
-
58
-
59
-
60
-
61
-
62
-
63
-
64
-
65
-
66
-
67
-
68
-
69
-
70
-
71
-
72
-
73
-
74
-
75
-
76
-
77
-
78
-
79
-
80
-
81
-
82
-
83
-
84
-
85
-
86
-
87
-
88
-
89
-
90
-
91
-
92
-
93
-
94
-
95
-
96
-
97
-
98
-
99
-
100
-
101
-
102
-
103
-
104
-
105
-
106
-
107
-
108
-
109
-
110
-
111
-
112
-
113
-
114
-
115
-
116
-
117
-
118
-
119
-
120
-
121
-
122
-
123
-
124
-
125
-
126
-
127
-
128
-
129
-
130
-
131
-
132
-
133
-
134
-
135
-
136
-
137
-
138
-
139
-
140
-
141
-
142
-
143
-
144
-
145
-
146
-
147
-
148
-
149
-
150
-
151
-
152
-
153
-
154
-
155
-
156
-
157
-
158
-
159
-
160
-
161
-
162
-
163
-
164
-
165
-
166
-
167
-
168
-
169
-
170
-
171
-
172
-
173
-
174
-
175
-
176
-
177
-
178
-
179
-
180
-
181
-
182
-
183
-
184
-
185
-
186
-
187
-
188
-
189
-
190
-
191
-
192
-
193
-
194
-
195
-
196
-
197
-
198
-
199
-
200
-
201
-
202
-
203
-
204
-
205
-
206
-
207
-
208
-
209
-
210
-
211
-
212
-
213
-
214
-
215
-
216
-
217
-
218
-
219
-
220
-
221
-
222
-
223
-
224
-
225
-
226
-
227
-
228
-
229
-
230
-
231
-
232
-
233
-
234
-
235
-
236
-
237
-
238
-
239
-
240
-
241
-
242
-
243
-
244
-
245
-
246
-
247
-
248
-
249
-
250
-
251
-
252
-
253
-
254
-
255
-
256
-
257
-
258
-
259
-
260
-
261
-
262
-
263
-
264
-
265
-
266
-
267
-
268
-
269
-
270
-
271
-
272
-
273
-
274
-
275
-
276
-
277
-
278
-
279
-
280
-
281
-
282
-
283
-
284
 |
 |

30 Bank of America 2013
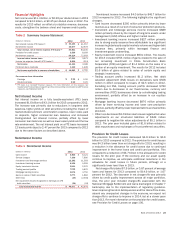
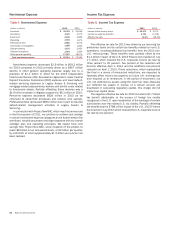
Net Interest Income Excluding Trading-related Net
Interest Income
We manage net interest income on a FTE basis and excluding the
impact of trading-related activities. As discussed in Global Markets
on page 44, we evaluate our sales and trading results and
strategies on a total market-based revenue approach by combining
net interest income and noninterest income for Global Markets.
An analysis of net interest income, average earning assets and
net interest yield on earning assets, all of which adjust for the
impact of trading-related net interest income from reported net
interest income on a FTE basis, is shown below. We believe the
use of this non-GAAP presentation in Table 9 provides additional
clarity in assessing our results.
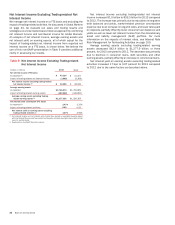
Table 9 Net Interest Income Excluding Trading-related
Net Interest Income
(Dollars in millions) 2013 2012
Net interest income (FTE basis)
As reported (1) $ 43,124 $ 41,557
Impact of trading-related net interest income (3,868) (3,308)
Net interest income excluding trading-related
net interest income (2) $ 39,256 $ 38,249
Average earning assets
As reported $ 1,746,974 $1,769,969
Impact of trading-related earning assets (469,048) (449,660)
Average earning assets excluding trading-
related earning assets (2) $ 1,277,926 $1,320,309
Net interest yield contribution (FTE basis)
As reported (1) 2.47% 2.35%
Impact of trading-related activities 0.60 0.55
Net interest yield on earning assets excluding
trading-related activities (2) 3.07% 2.90%
(1) Net interest income and net interest yield include fees earned on overnight deposits placed
with the Federal Reserve and fees earned on deposits, primarily overnight, placed with certain
non-U.S. central banks.
(2) Represents a non-GAAP financial measure.
Net interest income excluding trading-related net interest
income increased $1.0 billion to $39.3 billion for 2013 compared
to 2012. The increase was primarily due to reductions in long-term
debt balances and yields, market-related premium amortization
expense due to an increase in long-end rates, and lower rates paid
on deposits, partially offset by lower consumer loan balances and
yields as well as lower net interest income from the discretionary
asset and liability management (ALM) portfolio. For more
information on the impacts of interest rates, see Interest Rate
Risk Management for Nontrading Activities on page 109.
Average earning assets excluding trading-related earning
assets decreased $42.4 billion to $1,277.9 billion, or three
percent, for 2013 compared to 2012. The decrease was primarily
due to declines in consumer loans, debt securities and other
earning assets, partially offset by an increase in commercial loans.
Net interest yield on earning assets excluding trading-related
activities increased 17 bps to 3.07 percent for 2013 compared
to 2012 due to the same factors as described above.