Bank of America 2013 Annual Report Download - page 69
Download and view the complete annual report
Please find page 69 of the 2013 Bank of America annual report below. You can navigate through the pages in the report by either clicking on the pages listed below, or by using the keyword search tool below to find specific information within the annual report.-
 1
1 -
2
-
3
-
4
-
5
-
6
-
7
-
8
-
9
-
10
-
11
-
12
-
13
-
14
-
15
-
16
-
17
-
18
-
19
-
20
-
21
-
22
-
23
-
24
-
25
-
26
-
27
-
28
-
29
-
30
-
31
-
32
-
33
-
34
-
35
-
36
-
37
-
38
-
39
-
40
-
41
-
42
-
43
-
44
-
45
-
46
-
47
-
48
-
49
-
50
-
51
-
52
-
53
-
54
-
55
-
56
-
57
-
58
-
 59
59 -
 60
60 -
 61
61 -
 62
62 -
 63
63 -
 64
64 -
 65
65 -
 66
66 -
 67
67 -
 68
68 -
 69
69 -
 70
70 -
 71
71 -
 72
72 -
 73
73 -
 74
74 -
 75
75 -
 76
76 -
 77
77 -
 78
78 -
 79
79 -
80
-
81
-
82
-
83
-
84
-
85
-
86
-
87
-
88
-
89
-
90
-
91
-
92
-
93
-
94
-
95
-
96
-
97
-
98
-
99
-
100
-
101
-
102
-
103
-
104
-
105
-
106
-
107
-
108
-
109
-
110
-
111
-
112
-
113
-
114
-
115
-
116
-
117
-
118
-
119
-
120
-
121
-
122
-
123
-
124
-
125
-
126
-
127
-
128
-
129
-
130
-
131
-
132
-
133
-
134
-
135
-
136
-
137
-
138
-
139
-
140
-
141
-
142
-
143
-
144
-
145
-
146
-
147
-
148
-
149
-
150
-
151
-
152
-
153
-
154
-
155
-
156
-
157
-
158
-
159
-
160
-
161
-
162
-
163
-
164
-
165
-
166
-
167
-
168
-
169
-
170
-
171
-
172
-
173
-
174
-
175
-
176
-
177
-
178
-
179
-
180
-
181
-
182
-
183
-
184
-
185
-
186
-
187
-
188
-
189
-
190
-
191
-
192
-
193
-
194
-
195
-
196
-
197
-
198
-
199
-
200
-
201
-
202
-
203
-
204
-
205
-
206
-
207
-
208
-
209
-
210
-
211
-
212
-
213
-
214
-
215
-
216
-
217
-
218
-
219
-
220
-
221
-
222
-
223
-
224
-
225
-
226
-
227
-
228
-
229
-
230
-
231
-
232
-
233
-
234
-
235
-
236
-
237
-
238
-
239
-
240
-
241
-
242
-
243
-
244
-
245
-
246
-
247
-
248
-
249
-
250
-
251
-
252
-
253
-
254
-
255
-
256
-
257
-
258
-
259
-
260
-
261
-
262
-
263
-
264
-
265
-
266
-
267
-
268
-
269
-
270
-
271
-
272
-
273
-
274
-
275
-
276
-
277
-
278
-
279
-
280
-
281
-
282
-
283
-
284
 |
 |

Bank of America 2013 67
and leverage capital and stress test requirements. Also, a debt-
to-equity limit may be enacted for an individual BHC if determined
to pose a grave threat to the financial stability of the U.S., at the
discretion of the Financial Stability Oversight Council (FSOC) or
the Federal Reserve on behalf of the FSOC.
For more information regarding Basel 3 and other proposed
regulatory capital changes, see Note 16 – Regulatory Requirements
and Restrictions to the Consolidated Financial Statements.
Bank of America, N.A. and FIA Card Services, N.A.
Regulatory Capital
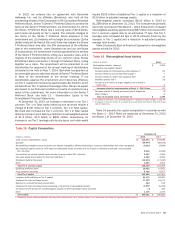
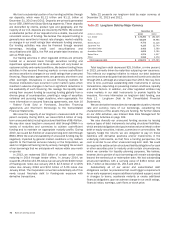
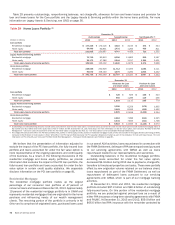
Table 19 presents regulatory capital information for BANA and FIA
at December 31, 2013 and 2012.
Table 19 Bank of America, N.A. and
FIA Card Services, N.A. Regulatory Capital (1)
December 31
2013 2012
(Dollars in millions) Ratio Amount Ratio Amount
Tier 1 capital
Bank of America, N.A. 12.34% $ 125,886 12.44% $ 118,431
FIA Card Services, N.A. 16.83 20,135 17.34 22,061
Total capital
Bank of America, N.A. 13.84 141,232 14.76 140,434
FIA Card Services, N.A. 18.12 21,672 18.64 23,707
Tier 1 leverage
Bank of America, N.A. 9.21 125,886 8.59 118,431
FIA Card Services, N.A. 12.91 20,135 13.67 22,061
(1) BANA regulatory capital information included the Basel 1 – 2013 Rules at December 31, 2013.
At December 31, 2012, BANA regulatory capital information did not include the Basel 1 – 2013
Rules. FIA is not impacted by the Basel 1 – 2013 Rules.
BANA’s Tier 1 capital ratio decreased 10 bps to 12.34 percent
and the Total capital ratio decreased 92 bps to 13.84 percent at
December 31, 2013 compared to December 31, 2012. The Tier
1 leverage ratio increased 62 bps to 9.21 percent at December 31,
2013 compared to December 31, 2012. The decrease in the Tier
1 capital ratio was driven by an increase in risk-weighted assets
of $68.5 billion compared to the prior year, dividends and returns
of capital to the Corporation of $8.5 billion and $2.2 billion during
2013, partially offset by earnings eligible to be included in capital
of $16.5 billion. The increase in risk-weighted assets was primarily
due to the impact of implementing the Basel 1 – 2013 Rules and
an increase in loans. The decrease in the Total capital ratio was
driven by the same factors as the Tier 1 capital ratio as well as a
$7.0 billion decrease in qualifying subordinated debt during 2013.
The increase in the Tier 1 leverage ratio was driven by an increase
in Tier 1 capital and a decrease in adjusted quarterly average total
assets of $11.6 billion.
FIA’s Tier 1 capital ratio decreased 51 bps to 16.83 percent
and the Total capital ratio decreased 52 bps to 18.12 percent at
December 31, 2013 compared to December 31, 2012. The Tier
1 leverage ratio decreased 76 bps to 12.91 percent at
December 31, 2013 compared to December 31, 2012. The
decrease in the Tier 1 capital and Total capital ratios was driven
by returns of capital of $6.5 billion to the Corporation during 2013,
partially offset by earnings eligible to be included in capital of $4.3
billion and a decrease in risk-weighted assets of $7.6 billion
primarily due to a decrease in loans. The decrease in the Tier 1
leverage ratio was driven by the decrease in Tier 1 capital, partially
offset by a decrease in adjusted quarterly average total assets of
$5.3 billion. FIA was not impacted by the implementation of the
Basel 1 – 2013 Rules.
Broker/Dealer Regulatory Capital and Securities
Regulation
The Corporation’s principal U.S. broker/dealer subsidiaries are
Merrill Lynch, Pierce, Fenner & Smith (MLPF&S) and Merrill Lynch
Professional Clearing Corp (MLPCC). MLPCC is a fully-guaranteed
subsidiary of MLPF&S and provides clearing and settlement
services. Both entities are subject to the net capital requirements
of SEC Rule 15c3-1. Both entities are also registered as futures
commission merchants and are subject to the Commodity Futures
Trading Commission Regulation 1.17.
MLPF&S has elected to compute the minimum capital
requirement in accordance with the Alternative Net Capital
Requirement as permitted by SEC Rule 15c3-1. At December 31,
2013, MLPF&S’s regulatory net capital as defined by Rule 15c3-1
was $10.0 billion and exceeded the minimum requirement of $951
million by $9.0 billion. MLPCC’s net capital of $2.2 billion exceeded
the minimum requirement of $366 million by $1.8 billion.
In accordance with the Alternative Net Capital Requirements,
MLPF&S is required to maintain tentative net capital in excess of
$1.0 billion, net capital in excess of $500 million and notify the
SEC in the event its tentative net capital is less than $5.0 billion.
At December 31, 2013, MLPF&S had tentative net capital and net
capital in excess of the minimum and notification requirements.
Merrill Lynch International (MLI), a U.K. investment firm, is
regulated by the PRA and the FCA and is subject to certain
regulatory capital requirements. Following an increase in capital
resources in advance of the implementation of Basel 3 in 2014,
at December 31, 2013, MLI’s capital resources were $28.2 billion
and exceeded the minimum requirement of $10.8 billion and had
enough excess to cover any additional requirements as set by the
regulators.
Common Stock Dividends
For a summary of our declared quarterly cash dividends on
common stock during 2013 and through February 25, 2014, see
Note 13 – Shareholders’ Equity to the Consolidated Financial
Statements.
Liquidity Risk
Funding and Liquidity Risk Management
We define liquidity risk as the potential inability to meet our
contractual and contingent financial obligations, on- or off-balance
sheet, as they come due. Our primary liquidity objective is to
provide adequate funding for our businesses throughout market
cycles, including periods of financial stress. To achieve that
objective, we analyze and monitor our liquidity risk, maintain excess
liquidity and access diverse funding sources including our stable
deposit base. We define excess liquidity as readily available
assets, limited to cash and high-quality, liquid, unencumbered
securities that we can use to meet our funding requirements as
those obligations arise.
Global funding and liquidity risk management activities are
centralized within Corporate Treasury. We believe that a centralized
approach to funding and liquidity risk management enhances our
ability to monitor liquidity requirements, maximizes access to
funding sources, minimizes borrowing costs and facilitates timely
responses to liquidity events.