Bank of America 2013 Annual Report Download - page 98
Download and view the complete annual report
Please find page 98 of the 2013 Bank of America annual report below. You can navigate through the pages in the report by either clicking on the pages listed below, or by using the keyword search tool below to find specific information within the annual report.-
 1
1 -
2
-
3
-
4
-
5
-
6
-
7
-
8
-
9
-
10
-
11
-
12
-
13
-
14
-
15
-
16
-
17
-
18
-
19
-
20
-
21
-
22
-
23
-
24
-
25
-
26
-
27
-
28
-
29
-
30
-
31
-
32
-
33
-
34
-
35
-
36
-
37
-
38
-
39
-
40
-
41
-
42
-
43
-
44
-
45
-
46
-
47
-
48
-
49
-
50
-
51
-
52
-
53
-
54
-
55
-
56
-
57
-
58
-
59
-
60
-
61
-
62
-
63
-
64
-
65
-
66
-
67
-
68
-
69
-
70
-
71
-
72
-
73
-
74
-
75
-
76
-
77
-
78
-
79
-
80
-
81
-
82
-
83
-
84
-
85
-
86
-
87
-
 88
88 -
 89
89 -
 90
90 -
 91
91 -
 92
92 -
 93
93 -
 94
94 -
 95
95 -
 96
96 -
 97
97 -
 98
98 -
 99
99 -
 100
100 -
 101
101 -
 102
102 -
 103
103 -
 104
104 -
 105
105 -
 106
106 -
 107
107 -
 108
108 -
109
-
110
-
111
-
112
-
113
-
114
-
115
-
116
-
117
-
118
-
119
-
120
-
121
-
122
-
123
-
124
-
125
-
126
-
127
-
128
-
129
-
130
-
131
-
132
-
133
-
134
-
135
-
136
-
137
-
138
-
139
-
140
-
141
-
142
-
143
-
144
-
145
-
146
-
147
-
148
-
149
-
150
-
151
-
152
-
153
-
154
-
155
-
156
-
157
-
158
-
159
-
160
-
161
-
162
-
163
-
164
-
165
-
166
-
167
-
168
-
169
-
170
-
171
-
172
-
173
-
174
-
175
-
176
-
177
-
178
-
179
-
180
-
181
-
182
-
183
-
184
-
185
-
186
-
187
-
188
-
189
-
190
-
191
-
192
-
193
-
194
-
195
-
196
-
197
-
198
-
199
-
200
-
201
-
202
-
203
-
204
-
205
-
206
-
207
-
208
-
209
-
210
-
211
-
212
-
213
-
214
-
215
-
216
-
217
-
218
-
219
-
220
-
221
-
222
-
223
-
224
-
225
-
226
-
227
-
228
-
229
-
230
-
231
-
232
-
233
-
234
-
235
-
236
-
237
-
238
-
239
-
240
-
241
-
242
-
243
-
244
-
245
-
246
-
247
-
248
-
249
-
250
-
251
-
252
-
253
-
254
-
255
-
256
-
257
-
258
-
259
-
260
-
261
-
262
-
263
-
264
-
265
-
266
-
267
-
268
-
269
-
270
-
271
-
272
-
273
-
274
-
275
-
276
-
277
-
278
-
279
-
280
-
281
-
282
-
283
-
284
 |
 |

96 Bank of America 2013
the amount of collateral required by the counterparty, where
applicable, and/or allow us to take additional protective measures
such as early termination of all trades.
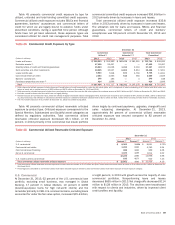
Table 57 presents the total contract/notional amount of credit
derivatives outstanding and includes both purchased and written
credit derivatives. The credit risk amounts are measured as net
asset exposure by counterparty, taking into consideration all
contracts with the counterparty. For more information on our written
credit derivatives, see Note 2 – Derivatives to the Consolidated
Financial Statements.
The credit risk amounts discussed above and presented in
Table 57 take into consideration the effects of legally enforceable
master netting agreements, while amounts disclosed in Note 2 –
Derivatives to the Consolidated Financial Statements are shown
on a gross basis. Credit risk reflects the potential benefit from
offsetting exposure to non-credit derivative products with the same
counterparties that may be netted upon the occurrence of certain
events, thereby reducing our overall exposure.
Table 57 Credit Derivatives
December 31
2013 2012
(Dollars in millions)
Contract/
Notional Credit Risk
Contract/
Notional Credit Risk
Purchased credit derivatives:
Credit default swaps $ 1,305,090 $ 6,042 $ 1,559,472 $ 8,987
Total return swaps/other 38,094 402 43,489 402
Total purchased credit derivatives $ 1,343,184 $ 6,444 $ 1,602,961 $ 9,389
Written credit derivatives:
Credit default swaps $ 1,265,380 n/a $ 1,531,504 n/a
Total return swaps/other 63,407 n/a 68,811 n/a
Total written credit derivatives $ 1,328,787 n/a $ 1,600,315 n/a
n/a = not applicable
Counterparty Credit Risk Valuation Adjustments
We record counterparty credit risk valuation adjustments on
certain derivative assets, including our credit default protection
purchased, in order to properly reflect the credit risk of the
counterparty. We calculate CVA based on a modeled expected
exposure that incorporates current market risk factors including
changes in market spreads and non-credit related market factors
that affect the value of a derivative. The exposure also takes into
consideration credit mitigants such as legally enforceable master
netting agreements and collateral. For additional information, see
Note 2 – Derivatives to the Consolidated Financial Statements.
Table 58 Credit Valuation Gains and Losses
2013 2012
(Dollars in millions) Gross Hedge Net Gross Hedge Net
Credit valuation
gains (losses) $ 738 $ (834) $ (96) $ 1,022 $ (731) $ 291
Non-U.S. Portfolio
Our non-U.S. credit and trading portfolios are subject to country
risk. We define country risk as the risk of loss from unfavorable
economic and political conditions, currency fluctuations, social
instability and changes in government policies. A risk management
framework is in place to measure, monitor and manage non-
U.S. risk and exposures. Management oversight of country risk,
including cross-border risk, is provided by the Country Credit Risk
Committee, a subcommittee of the CRC. In addition to the direct
risk of doing business in a country, we also are exposed to indirect
country risks (e.g., related to the collateral received on secured
financing transactions or related to client clearing activities). These
indirect exposures are managed in the normal course of business
through credit, market and operational risk governance, rather than
through country risk governance.
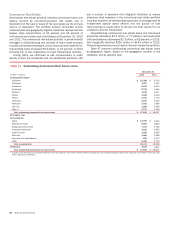
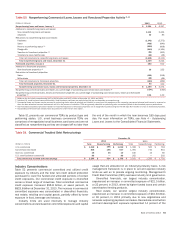
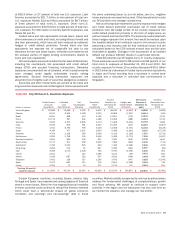
Table 59 presents our total non-U.S. exposure broken out by
region at December 31, 2013 and 2012. Non-U.S. exposure is
presented on an internal risk management basis and includes
sovereign and non-sovereign credit exposure, securities and other
investments issued by or domiciled in countries other than the
U.S. The risk assignments by country can be adjusted for external
guarantees and certain collateral types. Exposures that are subject
to external guarantees are reported under the country of the
guarantor. Exposures with tangible collateral are reflected in the
country where the collateral is held. For securities received, other
than cross-border resale agreements, outstandings are assigned
to the domicile of the issuer of the securities.
Table 59 Total Non-U.S. Exposure by Region
December 31
(Dollars in millions) 2013 2012
Europe $ 133,303 $ 137,778
Asia Pacific 69,266 92,412
Latin America 21,723 21,246
Middle East and Africa 8,691 8,200
Other (1) 20,866 22,014
Total $ 253,849 $ 281,650
(1) Other includes Canada exposure of $19.8 billion and $20.3 billion at December 31, 2013 and
2012.
Our total non-U.S. exposure was $253.8 billion at
December 31, 2013, a decrease of $27.8 billion from
December 31, 2012. The decrease in non-U.S. exposure was
driven by a reduction in Asia Pacific and Europe, partially offset by
growth in other regions. Our non-U.S. exposure remained
concentrated in Europe which accounted for $133.3 billion, or 53
percent of total non-U.S. exposure. The European exposure was
mostly in Western Europe and was distributed across a variety of
industries. Select European countries are further presented in
Table 61. Asia Pacific was our second largest non-U.S. exposure