Bank of America 2013 Annual Report Download - page 80
Download and view the complete annual report
Please find page 80 of the 2013 Bank of America annual report below. You can navigate through the pages in the report by either clicking on the pages listed below, or by using the keyword search tool below to find specific information within the annual report.-
 1
1 -
2
-
3
-
4
-
5
-
6
-
7
-
8
-
9
-
10
-
11
-
12
-
13
-
14
-
15
-
16
-
17
-
18
-
19
-
20
-
21
-
22
-
23
-
24
-
25
-
26
-
27
-
28
-
29
-
30
-
31
-
32
-
33
-
34
-
35
-
36
-
37
-
38
-
39
-
40
-
41
-
42
-
43
-
44
-
45
-
46
-
47
-
48
-
49
-
50
-
51
-
52
-
53
-
54
-
55
-
56
-
57
-
58
-
59
-
60
-
61
-
62
-
63
-
64
-
65
-
66
-
67
-
68
-
69
-
 70
70 -
 71
71 -
 72
72 -
 73
73 -
 74
74 -
 75
75 -
 76
76 -
 77
77 -
 78
78 -
 79
79 -
 80
80 -
 81
81 -
 82
82 -
 83
83 -
 84
84 -
 85
85 -
 86
86 -
 87
87 -
 88
88 -
 89
89 -
 90
90 -
91
-
92
-
93
-
94
-
95
-
96
-
97
-
98
-
99
-
100
-
101
-
102
-
103
-
104
-
105
-
106
-
107
-
108
-
109
-
110
-
111
-
112
-
113
-
114
-
115
-
116
-
117
-
118
-
119
-
120
-
121
-
122
-
123
-
124
-
125
-
126
-
127
-
128
-
129
-
130
-
131
-
132
-
133
-
134
-
135
-
136
-
137
-
138
-
139
-
140
-
141
-
142
-
143
-
144
-
145
-
146
-
147
-
148
-
149
-
150
-
151
-
152
-
153
-
154
-
155
-
156
-
157
-
158
-
159
-
160
-
161
-
162
-
163
-
164
-
165
-
166
-
167
-
168
-
169
-
170
-
171
-
172
-
173
-
174
-
175
-
176
-
177
-
178
-
179
-
180
-
181
-
182
-
183
-
184
-
185
-
186
-
187
-
188
-
189
-
190
-
191
-
192
-
193
-
194
-
195
-
196
-
197
-
198
-
199
-
200
-
201
-
202
-
203
-
204
-
205
-
206
-
207
-
208
-
209
-
210
-
211
-
212
-
213
-
214
-
215
-
216
-
217
-
218
-
219
-
220
-
221
-
222
-
223
-
224
-
225
-
226
-
227
-
228
-
229
-
230
-
231
-
232
-
233
-
234
-
235
-
236
-
237
-
238
-
239
-
240
-
241
-
242
-
243
-
244
-
245
-
246
-
247
-
248
-
249
-
250
-
251
-
252
-
253
-
254
-
255
-
256
-
257
-
258
-
259
-
260
-
261
-
262
-
263
-
264
-
265
-
266
-
267
-
268
-
269
-
270
-
271
-
272
-
273
-
274
-
275
-
276
-
277
-
278
-
279
-
280
-
281
-
282
-
283
-
284
 |
 |

78 Bank of America 2013
share of the losses in the portfolio. The residential mortgage loans
with all of these higher risk characteristics comprised two percent
and four percent of the residential mortgage portfolio at December
31, 2013 and 2012, and accounted for 10 percent and 20 percent
of the residential mortgage net charge-offs in 2013 and 2012.
Residential mortgage loans with a greater than 90 percent but
less than or equal to 100 percent refreshed LTV represented seven
percent and 10 percent of the residential mortgage portfolio at
December 31, 2013 and 2012. Loans with a refreshed LTV greater
than 100 percent represented 10 percent and 20 percent of the
residential mortgage loan portfolio at December 31, 2013 and
2012. Of the loans with a refreshed LTV greater than 100 percent,
94 percent and 92 percent were performing at December 31, 2013
and 2012. Loans with a refreshed LTV greater than 100 percent
reflect loans where the outstanding carrying value of the loan is
greater than the most recent valuation of the property securing
the loan. The majority of these loans have a refreshed LTV greater
than 100 percent primarily due to home price deterioration since
2006, somewhat mitigated by recent appreciation. Loans to
borrowers with refreshed FICO scores below 620 represented 11
percent and 14 percent of the residential mortgage portfolio at
December 31, 2013 and 2012.
Of the $142.1 billion in total residential mortgage loans
outstanding at December 31, 2013, as shown in Table 31, 40
percent were originated as interest-only loans. The outstanding
balance of interest-only residential mortgage loans that have
entered the amortization period was $15.4 billion, or 27 percent,
at December 31, 2013. Residential mortgage loans that have
entered the amortization period generally have experienced a
higher rate of early stage delinquencies and nonperforming status
compared to the residential mortgage portfolio as a whole. At
December 31, 2013, $320 million, or two percent of outstanding
interest-only residential mortgages that had entered the
amortization period were accruing past due 30 days or more
compared to $2.4 billion, or two percent for the entire residential
mortgage portfolio. In addition, at December 31, 2013, $2.5
billion, or 17 percent of outstanding interest-only residential
mortgages that had entered the amortization period were
nonperforming compared to $11.7 billion, or eight percent for the
entire residential mortgage portfolio. Loans in our interest-only
residential mortgage portfolio have an interest-only period of three
to ten years and more than 90 percent of these loans will not be
required to make a fully-amortizing payment until 2015 or later.
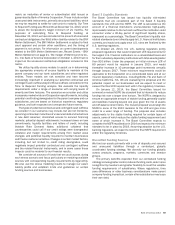
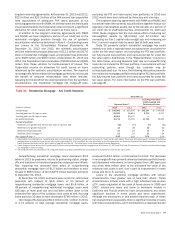
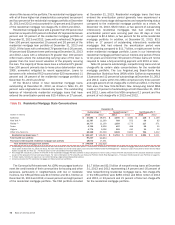
Table 31 presents outstandings, nonperforming loans and net
charge-offs by certain state concentrations for the residential
mortgage portfolio. The Los Angeles-Long Beach-Santa Ana
Metropolitan Statistical Area (MSA) within California represented
13 percent and 12 percent of outstandings at December 31, 2013
and 2012. Loans within this MSA comprised only three percent
and eight percent of net charge-offs in 2013 and 2012. In the New
York area, the New York-Northern New Jersey-Long Island MSA
made up 10 percent of outstandings at both December 31, 2013
and 2012. Loans within this MSA comprised 11 percent and five
percent of net charge-offs in 2013 and 2012.
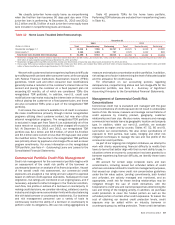
Table 31 Residential Mortgage State Concentrations
December 31
Outstandings (1) Nonperforming (1) Net Charge-offs (2)
(Dollars in millions) 2013 2012 2013 2012 2013 2012
California $ 47,885 $ 48,671 $ 3,396 $ 4,580 $148 $ 1,139
New York (3) 11,787 11,290 789 972 59 82
Florida (3) 10,777 11,100 1,359 1,773 117 371
Texas 6,766 6,928 407 498 25 55
Virginia 4,774 5,096 369 410 31 52
Other U.S./Non-U.S. 60,158 61,539 5,392 6,822 704 1,412
Residential mortgage loans (4) $ 142,147 $144,624 $ 11,712 $ 15,055 $ 1,084 $ 3,111
Fully-insured loan portfolio 87,247 90,854
Purchased credit-impaired residential mortgage loan portfolio 18,672 17,451
Total residential mortgage loan portfolio $ 248,066 $252,929
(1) Outstandings and nonperforming amounts exclude loans accounted for under the fair value option. There were $2.0 billion and $1.0 billion of residential mortgage loans accounted for under the fair
value option at December 31, 2013 and 2012. For more information on the fair value option, see Consumer Portfolio Credit Risk Management – Consumer Loans Accounted for Under the Fair Value
Option on page 85 and Note 21 – Fair Value Option to the Consolidated Financial Statements.
(2) Net charge-offs exclude $1.1 billion of write-offs in the residential mortgage PCI loan portfolio in 2013 compared to none in 2012. These write-offs decreased the PCI valuation allowance included
as part of the allowance for loan and lease losses. For more information on PCI write-offs, see Consumer Portfolio Credit Risk Management – Purchased Credit-impaired Loan Portfolio on page 81.
(3) In these states, foreclosure requires a court order following a legal proceeding (judicial states).
(4) Amount excludes the PCI residential mortgage and fully-insured loan portfolios.
The Community Reinvestment Act (CRA) encourages banks to
meet the credit needs of their communities for housing and other
purposes, particularly in neighborhoods with low or moderate
incomes. Our CRA portfolio was $10.3 billion and $11.3 billion at
December 31, 2013 and 2012, or seven percent and eight percent
of the residential mortgage portfolio. The CRA portfolio included
$1.7 billion and $2.5 billion of nonperforming loans at December
31, 2013 and 2012 representing 14 percent and 16 percent of
total nonperforming residential mortgage loans. Net charge-offs
in the CRA portfolio were $260 million and $641 million in 2013
and 2012, or 24 percent and 21 percent of total net charge-offs
for the residential mortgage portfolio.