Bank of America 2013 Annual Report Download - page 70
Download and view the complete annual report
Please find page 70 of the 2013 Bank of America annual report below. You can navigate through the pages in the report by either clicking on the pages listed below, or by using the keyword search tool below to find specific information within the annual report.-
 1
1 -
2
-
3
-
4
-
5
-
6
-
7
-
8
-
9
-
10
-
11
-
12
-
13
-
14
-
15
-
16
-
17
-
18
-
19
-
20
-
21
-
22
-
23
-
24
-
25
-
26
-
27
-
28
-
29
-
30
-
31
-
32
-
33
-
34
-
35
-
36
-
37
-
38
-
39
-
40
-
41
-
42
-
43
-
44
-
45
-
46
-
47
-
48
-
49
-
50
-
51
-
52
-
53
-
54
-
55
-
56
-
57
-
58
-
59
-
 60
60 -
 61
61 -
 62
62 -
 63
63 -
 64
64 -
 65
65 -
 66
66 -
 67
67 -
 68
68 -
 69
69 -
 70
70 -
 71
71 -
 72
72 -
 73
73 -
 74
74 -
 75
75 -
 76
76 -
 77
77 -
 78
78 -
 79
79 -
 80
80 -
81
-
82
-
83
-
84
-
85
-
86
-
87
-
88
-
89
-
90
-
91
-
92
-
93
-
94
-
95
-
96
-
97
-
98
-
99
-
100
-
101
-
102
-
103
-
104
-
105
-
106
-
107
-
108
-
109
-
110
-
111
-
112
-
113
-
114
-
115
-
116
-
117
-
118
-
119
-
120
-
121
-
122
-
123
-
124
-
125
-
126
-
127
-
128
-
129
-
130
-
131
-
132
-
133
-
134
-
135
-
136
-
137
-
138
-
139
-
140
-
141
-
142
-
143
-
144
-
145
-
146
-
147
-
148
-
149
-
150
-
151
-
152
-
153
-
154
-
155
-
156
-
157
-
158
-
159
-
160
-
161
-
162
-
163
-
164
-
165
-
166
-
167
-
168
-
169
-
170
-
171
-
172
-
173
-
174
-
175
-
176
-
177
-
178
-
179
-
180
-
181
-
182
-
183
-
184
-
185
-
186
-
187
-
188
-
189
-
190
-
191
-
192
-
193
-
194
-
195
-
196
-
197
-
198
-
199
-
200
-
201
-
202
-
203
-
204
-
205
-
206
-
207
-
208
-
209
-
210
-
211
-
212
-
213
-
214
-
215
-
216
-
217
-
218
-
219
-
220
-
221
-
222
-
223
-
224
-
225
-
226
-
227
-
228
-
229
-
230
-
231
-
232
-
233
-
234
-
235
-
236
-
237
-
238
-
239
-
240
-
241
-
242
-
243
-
244
-
245
-
246
-
247
-
248
-
249
-
250
-
251
-
252
-
253
-
254
-
255
-
256
-
257
-
258
-
259
-
260
-
261
-
262
-
263
-
264
-
265
-
266
-
267
-
268
-
269
-
270
-
271
-
272
-
273
-
274
-
275
-
276
-
277
-
278
-
279
-
280
-
281
-
282
-
283
-
284
 |
 |

68 Bank of America 2013
The Enterprise Risk Committee approves the Corporation’s
liquidity policy and contingency funding plan, including establishing
liquidity risk tolerance levels. The ALMRC monitors our liquidity
position and reviews the impact of strategic decisions on our
liquidity. ALMRC is responsible for managing liquidity risks and
maintaining exposures within the established tolerance levels.
ALMRC delegates additional oversight responsibilities to the
CFORC, which reports to the ALMRC. The CFORC reviews and
monitors our liquidity position, cash flow forecasts, stress testing
scenarios and results, and implements our liquidity limits and
guidelines. For additional information, see Managing Risk – Board
Oversight of Risk on page 59. Under this governance framework,
we have developed certain funding and liquidity risk management
practices which include: maintaining excess liquidity at the parent
company and selected subsidiaries, including our bank
subsidiaries and other regulated entities; determining what
amounts of excess liquidity are appropriate for these entities
based on analysis of debt maturities and other potential cash
outflows, including those that we may experience during stressed
market conditions; diversifying funding sources, considering our
asset profile and legal entity structure; and performing contingency
planning.
Global Excess Liquidity Sources and Other
Unencumbered Assets
We maintain excess liquidity available to Bank of America
Corporation, or the parent company and selected subsidiaries in
the form of cash and high-quality, liquid, unencumbered securities.
These assets, which we call our Global Excess Liquidity Sources,
serve as our primary means of liquidity risk mitigation. Our cash
is primarily on deposit with the Federal Reserve and central banks
outside of the U.S. We limit the composition of high-quality, liquid,
unencumbered securities to U.S. government securities, U.S.
agency securities, U.S. agency MBS and a select group of non-
U.S. government and supranational securities. We believe we can
quickly obtain cash for these securities, even in stressed market
conditions, through repurchase agreements or outright sales. We
hold our Global Excess Liquidity Sources in entities that allow us
to meet the liquidity requirements of our global businesses, and
we consider the impact of potential regulatory, tax, legal and other
restrictions that could limit the transferability of funds among
entities. Our Global Excess Liquidity Sources metric is similar to
High Quality Liquid Assets in the proposed LCR rulemaking. For
more information on the proposed rulemaking, see Liquidity Risk
– Basel 3 Liquidity Standards on page 69.
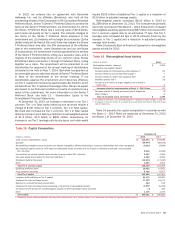
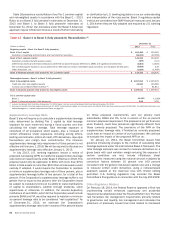
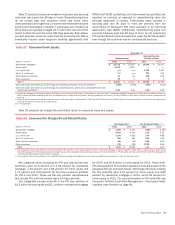
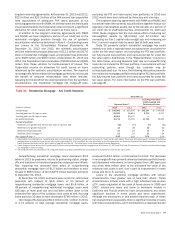
Our Global Excess Liquidity Sources were $376 billion and
$372 billion at December 31, 2013 and 2012 and were maintained
as presented in Table 20.
Table 20 Global Excess Liquidity Sources
December 31
Average for
Three Months
Ended
December 31
2013
(Dollars in billions) 2013 2012
Parent company $95
$ 103 $92
Bank subsidiaries 249 247 248
Other regulated entities 32 22 30
Total Global Excess Liquidity Sources $ 376 $ 372 $ 370
As shown in Table 20, parent company Global Excess Liquidity
Sources totaled $95 billion and $103 billion at December 31,
2013 and 2012. The decrease in parent company liquidity was
primarily due to debt maturities and capital actions, partially offset
by capital returns from subsidiaries and debt issuances. Typically,
parent company cash is deposited overnight with BANA.
Global Excess Liquidity Sources available to our bank
subsidiaries totaled $249 billion and $247 billion at December
31, 2013 and 2012. The bank subsidiaries’ liquidity remained
relatively unchanged as deposit growth and an increase in short-
term borrowings was largely offset by loan growth, a decrease in
the fair value of debt securities and capital returns to the parent
company. Liquidity amounts are distinct from the cash deposited
by the parent company. Our bank subsidiaries can also generate
incremental liquidity by pledging a range of other unencumbered
loans and securities to certain FHLBs and the Federal Reserve
Discount Window. The cash we could have obtained by borrowing
against this pool of specifically-identified eligible assets was
approximately $218 billion and $194 billion at December 31, 2013
and 2012. We have established operational procedures to enable
us to borrow against these assets, including regularly monitoring
our total pool of eligible loans and securities collateral. Eligibility
is defined by guidelines outlined by the FHLBs and the Federal
Reserve and is subject to change at their discretion. Due to
regulatory restrictions, liquidity generated by the bank subsidiaries
can only be used to fund obligations within the bank subsidiaries
and can only be transferred to the parent company or non-bank
subsidiaries with prior regulatory approval.
Global Excess Liquidity Sources available to our other regulated
entities totaled $32 billion and $22 billion at December 31, 2013
and 2012. Our other regulated entities also held other
unencumbered investment-grade securities and equities that we
believe could be used to generate additional liquidity. Liquidity held
in an other regulated entity is primarily available to meet the
obligations of that entity and transfers to the parent company or
to any other subsidiary may be subject to prior regulatory approval
due to regulatory restrictions and minimum requirements.
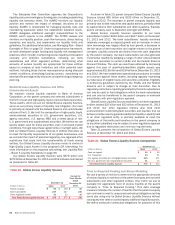
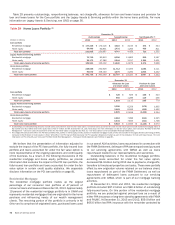
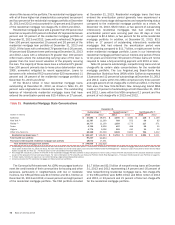
Table 21 presents the composition of Global Excess Liquidity
Sources at December 31, 2013 and 2012.
Table 21 Global Excess Liquidity Sources Composition
December 31
(Dollars in billions) 2013 2012
Cash on deposit $90
$65
U.S. Treasuries 20 21
U.S. agency securities and mortgage-backed securities 245 271
Non-U.S. government and supranational securities 21 15
Total Global Excess Liquidity Sources $ 376 $ 372
Time to Required Funding and Stress Modeling
We use a variety of metrics to determine the appropriate amounts
of excess liquidity to maintain at the parent company and our bank
subsidiaries and other regulated entities. One metric we use to
evaluate the appropriate level of excess liquidity at the parent
company is “Time to Required Funding.” This debt coverage
measure indicates the number of months that the parent company
can continue to meet its unsecured contractual obligations as they
come due using only its Global Excess Liquidity Sources without
issuing any new debt or accessing any additional liquidity sources.
We define unsecured contractual obligations for purposes of this