Bank of America 2013 Annual Report Download - page 192
Download and view the complete annual report
Please find page 192 of the 2013 Bank of America annual report below. You can navigate through the pages in the report by either clicking on the pages listed below, or by using the keyword search tool below to find specific information within the annual report.-
 1
1 -
2
-
3
-
4
-
5
-
6
-
7
-
8
-
9
-
10
-
11
-
12
-
13
-
14
-
15
-
16
-
17
-
18
-
19
-
20
-
21
-
22
-
23
-
24
-
25
-
26
-
27
-
28
-
29
-
30
-
31
-
32
-
33
-
34
-
35
-
36
-
37
-
38
-
39
-
40
-
41
-
42
-
43
-
44
-
45
-
46
-
47
-
48
-
49
-
50
-
51
-
52
-
53
-
54
-
55
-
56
-
57
-
58
-
59
-
60
-
61
-
62
-
63
-
64
-
65
-
66
-
67
-
68
-
69
-
70
-
71
-
72
-
73
-
74
-
75
-
76
-
77
-
78
-
79
-
80
-
81
-
82
-
83
-
84
-
85
-
86
-
87
-
88
-
89
-
90
-
91
-
92
-
93
-
94
-
95
-
96
-
97
-
98
-
99
-
100
-
101
-
102
-
103
-
104
-
105
-
106
-
107
-
108
-
109
-
110
-
111
-
112
-
113
-
114
-
115
-
116
-
117
-
118
-
119
-
120
-
121
-
122
-
123
-
124
-
125
-
126
-
127
-
128
-
129
-
130
-
131
-
132
-
133
-
134
-
135
-
136
-
137
-
138
-
139
-
140
-
141
-
142
-
143
-
144
-
145
-
146
-
147
-
148
-
149
-
150
-
151
-
152
-
153
-
154
-
155
-
156
-
157
-
158
-
159
-
160
-
161
-
162
-
163
-
164
-
165
-
166
-
167
-
168
-
169
-
170
-
171
-
172
-
173
-
174
-
175
-
176
-
177
-
178
-
179
-
180
-
181
-
 182
182 -
 183
183 -
 184
184 -
 185
185 -
 186
186 -
 187
187 -
 188
188 -
 189
189 -
 190
190 -
 191
191 -
 192
192 -
 193
193 -
 194
194 -
 195
195 -
 196
196 -
 197
197 -
 198
198 -
 199
199 -
 200
200 -
 201
201 -
 202
202 -
203
-
204
-
205
-
206
-
207
-
208
-
209
-
210
-
211
-
212
-
213
-
214
-
215
-
216
-
217
-
218
-
219
-
220
-
221
-
222
-
223
-
224
-
225
-
226
-
227
-
228
-
229
-
230
-
231
-
232
-
233
-
234
-
235
-
236
-
237
-
238
-
239
-
240
-
241
-
242
-
243
-
244
-
245
-
246
-
247
-
248
-
249
-
250
-
251
-
252
-
253
-
254
-
255
-
256
-
257
-
258
-
259
-
260
-
261
-
262
-
263
-
264
-
265
-
266
-
267
-
268
-
269
-
270
-
271
-
272
-
273
-
274
-
275
-
276
-
277
-
278
-
279
-
280
-
281
-
282
-
283
-
284
 |
 |

190 Bank of America 2013
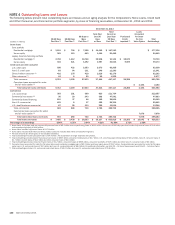
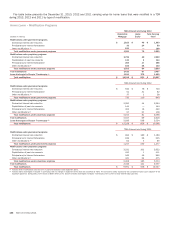
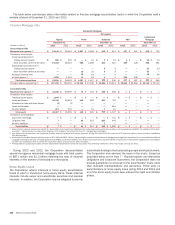
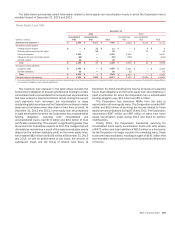
The table below provides information on the Corporation’s renegotiated TDR portfolio in the Credit Card and Other Consumer portfolio
segment at December 31, 2013 and 2012, and for 2013, 2012 and 2011.
Impaired Loans – Credit Card and Other Consumer – Renegotiated TDRs
December 31, 2013 December 31, 2012
(Dollars in millions)
Unpaid
Principal
Balance
Carrying
Value (1)
Related
Allowance
Unpaid
Principal
Balance
Carrying
Value (1)
Related
Allowance
With an allowance recorded
U.S. credit card $ 1,384 $ 1,465 $ 337 $ 2,856 $ 2,871 $ 719
Non-U.S. credit card 200 240 149 311 316 198
Direct/Indirect consumer 242 282 84 633 636 210
Other consumer 27 26 9 30 30 12
With no recorded allowance
Direct/Indirect consumer 75 32 — 105 58 —
Other consumer 34 34 — 35 35 —
Total
U.S. credit card $ 1,384 $ 1,465 $ 337 $ 2,856 $ 2,871 $ 719
Non-U.S. credit card 200 240 149 311 316 198
Direct/Indirect consumer 317 314 84 738 694 210
Other consumer 61 60 9 65 65 12
2013 2012 2011
Average
Carrying
Value
Interest
Income
Recognized (2)
Average
Carrying
Value
Interest
Income
Recognized (2)
Average
Carrying
Value
Interest
Income
Recognized (2)
With an allowance recorded
U.S. credit card $ 2,144 $ 134 $ 4,085 $ 253 $ 7,211 $ 433
Non-U.S. credit card 266 7 464 10 759 6
Direct/Indirect consumer 456 24 929 50 1,582 85
Other consumer 28 2 29 2 30 2
With no recorded allowance
Direct/Indirect consumer 42 — 58———
Other consumer 34 2 35 2 30 2
Total
U.S. credit card $ 2,144 $ 134 $ 4,085 $ 253 $ 7,211 $ 433
Non-U.S. credit card 266 7 464 10 759 6
Direct/Indirect consumer 498 24 987 50 1,582 85
Other consumer 62 4 64 4 60 4
(1) Includes accrued interest and fees.
(2) Interest income recognized includes interest accrued and collected on the outstanding balances of accruing impaired loans as well as interest cash collections on nonaccruing impaired loans for
which the principal is considered collectible.
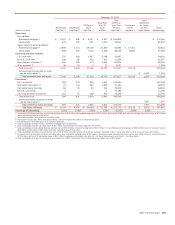
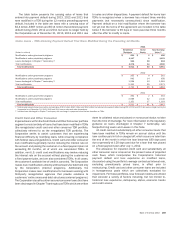
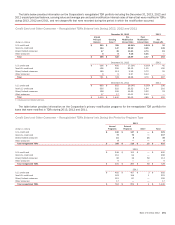
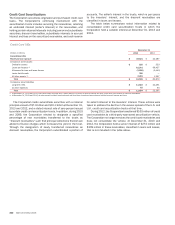
The table below provides information on the Corporation’s primary modification programs for the renegotiated TDR portfolio at
December 31, 2013 and 2012.
Credit Card and Other Consumer – Renegotiated TDRs by Program Type
December 31
Internal Programs External Programs Other Total
Percent of Balances Current or
Less Than 30 Days Past Due
(Dollars in millions) 2013 2012 2013 2012 2013 2012 2013 2012 2013 2012
U.S. credit card $ 842 $ 1,887 $ 607 $ 953 $16
$31
$ 1,465 $ 2,871 82.77% 81.48%
Non-U.S. credit card 71 99 26 38 143 179 240 316 49.01 43.71
Direct/Indirect consumer 170 405 106 225 38 64 314 694 84.29 83.11
Other consumer 60 65 ————60 65 71.08 72.73
Total renegotiated TDRs $ 1,143 $ 2,456 $ 739 $ 1,216 $197 $ 274 $ 2,079 $ 3,946 78.77 78.58