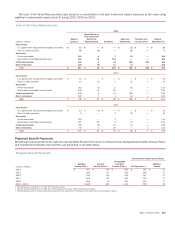
Bank of America 2013 Annual Report Download - page 254
Download and view the complete annual report
Please find page 254 of the 2013 Bank of America annual report below. You can navigate through the pages in the report by either clicking on the pages listed below, or by using the keyword search tool below to find specific information within the annual report.-
 1
1 -
2
-
3
-
4
-
5
-
6
-
7
-
8
-
9
-
10
-
11
-
12
-
13
-
14
-
15
-
16
-
17
-
18
-
19
-
20
-
21
-
22
-
23
-
24
-
25
-
26
-
27
-
28
-
29
-
30
-
31
-
32
-
33
-
34
-
35
-
36
-
37
-
38
-
39
-
40
-
41
-
42
-
43
-
44
-
45
-
46
-
47
-
48
-
49
-
50
-
51
-
52
-
53
-
54
-
55
-
56
-
57
-
58
-
59
-
60
-
61
-
62
-
63
-
64
-
65
-
66
-
67
-
68
-
69
-
70
-
71
-
72
-
73
-
74
-
75
-
76
-
77
-
78
-
79
-
80
-
81
-
82
-
83
-
84
-
85
-
86
-
87
-
88
-
89
-
90
-
91
-
92
-
93
-
94
-
95
-
96
-
97
-
98
-
99
-
100
-
101
-
102
-
103
-
104
-
105
-
106
-
107
-
108
-
109
-
110
-
111
-
112
-
113
-
114
-
115
-
116
-
117
-
118
-
119
-
120
-
121
-
122
-
123
-
124
-
125
-
126
-
127
-
128
-
129
-
130
-
131
-
132
-
133
-
134
-
135
-
136
-
137
-
138
-
139
-
140
-
141
-
142
-
143
-
144
-
145
-
146
-
147
-
148
-
149
-
150
-
151
-
152
-
153
-
154
-
155
-
156
-
157
-
158
-
159
-
160
-
161
-
162
-
163
-
164
-
165
-
166
-
167
-
168
-
169
-
170
-
171
-
172
-
173
-
174
-
175
-
176
-
177
-
178
-
179
-
180
-
181
-
182
-
183
-
184
-
185
-
186
-
187
-
188
-
189
-
190
-
191
-
192
-
193
-
194
-
195
-
196
-
197
-
198
-
199
-
200
-
201
-
202
-
203
-
204
-
205
-
206
-
207
-
208
-
209
-
210
-
211
-
212
-
213
-
214
-
215
-
216
-
217
-
218
-
219
-
220
-
221
-
222
-
223
-
224
-
225
-
226
-
227
-
228
-
229
-
230
-
231
-
232
-
233
-
234
-
235
-
236
-
237
-
238
-
239
-
240
-
241
-
242
-
243
-
 244
244 -
 245
245 -
 246
246 -
 247
247 -
 248
248 -
 249
249 -
 250
250 -
 251
251 -
 252
252 -
 253
253 -
 254
254 -
 255
255 -
 256
256 -
 257
257 -
 258
258 -
 259
259 -
 260
260 -
 261
261 -
 262
262 -
 263
263 -
 264
264 -
265
-
266
-
267
-
268
-
269
-
270
-
271
-
272
-
273
-
274
-
275
-
276
-
277
-
278
-
279
-
280
-
281
-
282
-
283
-
284
 |
 |
252 Bank of America 2013
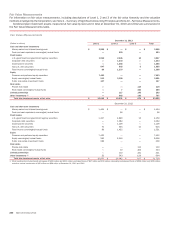
NOTE 20 Fair Value Measurements
Under applicable accounting guidance, fair value is defined as the
exchange price that would be received for an asset or paid to
transfer a liability (an exit price) in the principal or most
advantageous market for the asset or liability in an orderly
transaction between market participants on the measurement
date. The Corporation determines the fair values of its financial
instruments based on the fair value hierarchy established under
applicable accounting guidance which requires an entity to
maximize the use of observable inputs and minimize the use of
unobservable inputs when measuring fair value. There are three
levels of inputs used to measure fair value. The Corporation
conducts a review of its fair value hierarchy classifications on a
quarterly basis. Transfers into or out of fair value hierarchy
classifications are made if the significant inputs used in the
financial models measuring the fair values of the assets and
liabilities became unobservable or observable, respectively, in the
current marketplace. These transfers are considered to be
effective as of the beginning of the quarter in which they occur.
For more information regarding the fair value hierarchy and how
the Corporation measures fair value, see Note 1 – Summary of
Significant Accounting Principles. The Corporation accounts for
certain financial instruments under the fair value option. For
additional information, see Note 21 – Fair Value Option.
Valuation Processes and Techniques
The Corporation has various processes and controls in place to
ensure that fair value is reasonably estimated. A model validation
policy governs the use and control of valuation models used to
estimate fair value. This policy requires review and approval of
models by personnel who are independent of the front office, and
periodic reassessments of models to ensure that they are
continuing to perform as designed. In addition, detailed reviews
of trading gains and losses are conducted on a daily basis by
personnel who are independent of the front office. A price
verification group, which is also independent of the front office,
utilizes available market information including executed trades,
market prices and market-observable valuation model inputs to
ensure that fair values are reasonably estimated. The Corporation
performs due diligence procedures over third-party pricing service
providers in order to support their use in the valuation process.
Where market information is not available to support internal
valuations, independent reviews of the valuations are performed
and any material exposures are escalated through a management
review process.
While the Corporation believes its valuation methods are
appropriate and consistent with other market participants, the use
of different methodologies or assumptions to determine the fair
value of certain financial instruments could result in a different
estimate of fair value at the reporting date.
During 2013, there were no changes to the valuation
techniques that had, or are expected to have, a material impact
on the Corporation’s consolidated financial position or results of
operations.
Level 1, 2 and 3 Valuation Techniques
Financial instruments are considered Level 1 when the valuation
is based on quoted prices in active markets for identical assets
or liabilities. Level 2 financial instruments are valued using quoted
prices for similar assets or liabilities, quoted prices in markets
that are not active, or models using inputs that are observable or
can be corroborated by observable market data for substantially
the full term of the assets or liabilities. Financial instruments are
considered Level 3 when their values are determined using pricing
models, discounted cash flow methodologies or similar
techniques, and at least one significant model assumption or input
is unobservable and when determination of the fair value requires
significant management judgment or estimation.
Trading Account Assets and Liabilities and Debt Securities
The fair values of trading account assets and liabilities are primarily
based on actively traded markets where prices are based on either
direct market quotes or observed transactions. The fair values of
debt securities are generally based on quoted market prices or
market prices for similar assets. Liquidity is a significant factor in
the determination of the fair values of trading account assets and
liabilities and debt securities. Market price quotes may not be
readily available for some positions, or positions within a market
sector where trading activity has slowed significantly or ceased.
Some of these instruments are valued using a discounted cash
flow model, which estimates the fair value of the securities using
internal credit risk, interest rate and prepayment risk models that
incorporate management’s best estimate of current key
assumptions such as default rates, loss severity and prepayment
rates. Principal and interest cash flows are discounted using an
observable discount rate for similar instruments with adjustments
that management believes a market participant would consider in
determining fair value for the specific security. Other instruments
are valued using a net asset value approach which considers the
value of the underlying securities. Underlying assets are valued
using external pricing services, where available, or matrix pricing
based on the vintages and ratings. Situations of illiquidity generally
are triggered by the market’s perception of credit uncertainty
regarding a single company or a specific market sector. In these
instances, fair value is determined based on limited available
market information and other factors, principally from reviewing
the issuer’s financial statements and changes in credit ratings
made by one or more rating agencies.
Derivative Assets and Liabilities
The fair values of derivative assets and liabilities traded in the
OTC market are determined using quantitative models that utilize
multiple market inputs including interest rates, prices and indices
to generate continuous yield or pricing curves and volatility factors
to value the position. The majority of market inputs are actively
quoted and can be validated through external sources, including
brokers, market transactions and third-party pricing services.
When third-party pricing services are used, the methods and
assumptions are reviewed by the Corporation. Estimation risk is
greater for derivative asset and liability positions that are either
option-based or have longer maturity dates where observable
market inputs are less readily available, or are unobservable, in
which case, quantitative-based extrapolations of rate, price or
index scenarios are used in determining fair values. The fair values
of derivative assets and liabilities include adjustments for market
liquidity, counterparty credit quality and other instrument-specific
factors, where appropriate. In addition, the Corporation
incorporates within its fair value measurements of OTC derivatives
a valuation adjustment to reflect the credit risk associated with
the net position. Positions are netted by counterparty, and fair
value for net long exposures is adjusted for counterparty credit
risk while the fair value for net short exposures is adjusted for the