Bank of America 2013 Annual Report Download - page 99
Download and view the complete annual report
Please find page 99 of the 2013 Bank of America annual report below. You can navigate through the pages in the report by either clicking on the pages listed below, or by using the keyword search tool below to find specific information within the annual report.-
 1
1 -
2
-
3
-
4
-
5
-
6
-
7
-
8
-
9
-
10
-
11
-
12
-
13
-
14
-
15
-
16
-
17
-
18
-
19
-
20
-
21
-
22
-
23
-
24
-
25
-
26
-
27
-
28
-
29
-
30
-
31
-
32
-
33
-
34
-
35
-
36
-
37
-
38
-
39
-
40
-
41
-
42
-
43
-
44
-
45
-
46
-
47
-
48
-
49
-
50
-
51
-
52
-
53
-
54
-
55
-
56
-
57
-
58
-
59
-
60
-
61
-
62
-
63
-
64
-
65
-
66
-
67
-
68
-
69
-
70
-
71
-
72
-
73
-
74
-
75
-
76
-
77
-
78
-
79
-
80
-
81
-
82
-
83
-
84
-
85
-
86
-
87
-
88
-
 89
89 -
 90
90 -
 91
91 -
 92
92 -
 93
93 -
 94
94 -
 95
95 -
 96
96 -
 97
97 -
 98
98 -
 99
99 -
 100
100 -
 101
101 -
 102
102 -
 103
103 -
 104
104 -
 105
105 -
 106
106 -
 107
107 -
 108
108 -
 109
109 -
110
-
111
-
112
-
113
-
114
-
115
-
116
-
117
-
118
-
119
-
120
-
121
-
122
-
123
-
124
-
125
-
126
-
127
-
128
-
129
-
130
-
131
-
132
-
133
-
134
-
135
-
136
-
137
-
138
-
139
-
140
-
141
-
142
-
143
-
144
-
145
-
146
-
147
-
148
-
149
-
150
-
151
-
152
-
153
-
154
-
155
-
156
-
157
-
158
-
159
-
160
-
161
-
162
-
163
-
164
-
165
-
166
-
167
-
168
-
169
-
170
-
171
-
172
-
173
-
174
-
175
-
176
-
177
-
178
-
179
-
180
-
181
-
182
-
183
-
184
-
185
-
186
-
187
-
188
-
189
-
190
-
191
-
192
-
193
-
194
-
195
-
196
-
197
-
198
-
199
-
200
-
201
-
202
-
203
-
204
-
205
-
206
-
207
-
208
-
209
-
210
-
211
-
212
-
213
-
214
-
215
-
216
-
217
-
218
-
219
-
220
-
221
-
222
-
223
-
224
-
225
-
226
-
227
-
228
-
229
-
230
-
231
-
232
-
233
-
234
-
235
-
236
-
237
-
238
-
239
-
240
-
241
-
242
-
243
-
244
-
245
-
246
-
247
-
248
-
249
-
250
-
251
-
252
-
253
-
254
-
255
-
256
-
257
-
258
-
259
-
260
-
261
-
262
-
263
-
264
-
265
-
266
-
267
-
268
-
269
-
270
-
271
-
272
-
273
-
274
-
275
-
276
-
277
-
278
-
279
-
280
-
281
-
282
-
283
-
284
 |
 |

Bank of America 2013 97
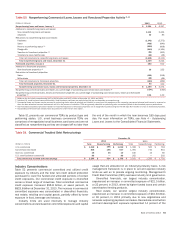
at $69.3 billion, or 27 percent of total non-U.S. exposure. Latin
America accounted for $21.7 billion, or nine percent of total non-
U.S. exposure. Middle East and Africa accounted for $8.7 billion,
or three percent of total non-U.S. exposure. Other non-U.S.
exposure accounted for $20.9 billion or eight percent of total non-
U.S. exposure. For information on country specific exposures, see
Tables 60 and 61.
Funded loans and loan equivalents include loans, leases and
other extensions of credit and funds, including letters of credit and
due from placements, which have not been reduced by collateral,
hedges or credit default protection. Funded loans and loan
equivalents are reported net of charge-offs but prior to any
allowance for loan and lease losses. Unfunded commitments are
the undrawn portion of legally binding commitments related to
loans and loan equivalents.
Net counterparty exposure includes the fair value of derivatives,
including the counterparty risk associated with credit default
swaps (CDS) and secured financing transactions. Derivative
exposures are presented net of collateral, which is predominantly
cash, pledged under legally enforceable master netting
agreements. Secured financing transaction exposures are
presented net of eligible cash or securities pledged as collateral.
Securities and other investments are carried at fair value and
long securities exposures are netted against short exposures with
the same underlying issuer to, but not below, zero (i.e., negative
issuer exposures are reported as zero). Other investments include
our GPI portfolio and strategic investments.
Net country exposure represents country exposure less hedges
and credit default protection purchased, net of credit default
protection sold. We hedge certain of our country exposures with
credit default protection primarily in the form of single-name, as
well as indexed and tranched CDS. The exposures associated with
these hedges represent the amount that would be realized upon
the isolated default of an individual issuer in the relevant country
assuming a zero recovery rate for that individual issuer, and are
calculated based on the CDS notional amount less any fair value
receivable or payable. Changes in the assumption of an isolated
default can produce different results in a particular tranche.
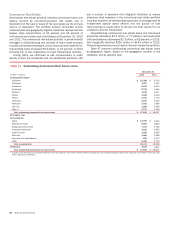
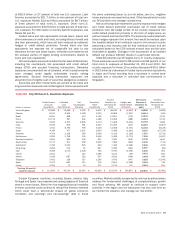
Table 60 presents our 20 largest non-U.S. country exposures.
These exposures accounted for 88 percent and 89 percent of our
total non-U.S. exposure at December 31, 2013 and 2012. Net
country exposure for these 20 countries decreased $30.5 billion
in 2013 driven by a decrease in funded loans and loan equivalents
in Japan and France resulting from a decrease in central bank
deposits and a reduction in unfunded loan commitments in
Singapore.
Table 60 Top 20 Non-U.S. Countries Exposure
(Dollars in millions)
Funded Loans
and Loan
Equivalents
Unfunded
Loan
Commitments
Net
Counterparty
Exposure
Securities/
Other
Investments
Country
Exposure at
December 31
2013
Hedges and
Credit Default
Protection
Net Country
Exposure at
December 31
2013
Increase
(Decrease) from
December 31
2012
United Kingdom $ 25,898 $ 12,046 $ 5,259 $ 4,812 $ 48,015 $ (4,429) $43,586 $ (3,606)
Canada 6,075 6,942 1,568 5,223 19,808 (1,397) 18,411 (565)
Brazil 8,591 698 416 4,106 13,811 (179) 13,632 1,129
China 10,712 587 642 1,468 13,409 (488) 12,921 3,734
Germany 6,262 4,973 2,800 3,173 17,208 (4,490) 12,718 1,698
India 6,256 643 361 3,204 10,464 (213) 10,251 (3,467)
France 1,914 6,790 976 5,228 14,908 (4,745) 10,163 (6,128)
Japan 4,340 477 1,827 2,854 9,498 (1,383) 8,115 (15,724)
Australia 4,374 2,136 565 2,048 9,123 (1,126) 7,997 (1,732)
Netherlands 3,599 2,758 555 2,496 9,408 (1,773) 7,635 (3,047)
Russian Federation 5,824 960 230 621 7,635 (913) 6,722 1,810
South Korea 3,771 811 566 2,236 7,384 (949) 6,435 (714)
Switzerland 2,760 3,150 625 629 7,164 (1,618) 5,546 (274)
Hong Kong 4,296 374 81 847 5,598 (241) 5,357 (86)
Italy 3,096 3,573 2,328 763 9,760 (4,558) 5,202 364
Taiwan 2,614 — 132 1,385 4,131 (59) 4,072 850
Mexico 3,030 687 129 657 4,503 (504) 3,999 340
Singapore 2,401 138 157 1,280 3,976 (147) 3,829 (6,345)
Spain 3,475 892 115 519 5,001 (1,598) 3,403 749
Turkey 2,354 75 10 271 2,710 (17) 2,693 551
Total top 20 non-U.S.
countries exposure $ 111,642 $ 48,710 $ 19,342 $ 43,820 $ 223,514 $ (30,827) $ 192,687 $ (30,463)
Certain European countries, including Greece, Ireland, Italy,
Portugal and Spain, have experienced varying degrees of financial
stress in recent years. Risks from the ongoing financial instability
in these countries could continue to disrupt the financial markets
which could have a detrimental impact on global economic
conditions and sovereign and non-sovereign debt in these
countries. Market volatility is expected to continue as policymakers
address the fundamental challenges of competitiveness, growth
and fiscal solvency. We expect to continue to support client
activities in the region and our exposures may vary over time as
we monitor the situation and manage our risk profile.