Bank of America 2013 Annual Report Download - page 39
Download and view the complete annual report
Please find page 39 of the 2013 Bank of America annual report below. You can navigate through the pages in the report by either clicking on the pages listed below, or by using the keyword search tool below to find specific information within the annual report.-
 1
1 -
2
-
3
-
4
-
5
-
6
-
7
-
8
-
9
-
10
-
11
-
12
-
13
-
14
-
15
-
16
-
17
-
18
-
19
-
20
-
21
-
22
-
23
-
24
-
25
-
26
-
27
-
28
-
 29
29 -
 30
30 -
 31
31 -
 32
32 -
 33
33 -
 34
34 -
 35
35 -
 36
36 -
 37
37 -
 38
38 -
 39
39 -
 40
40 -
 41
41 -
 42
42 -
 43
43 -
 44
44 -
 45
45 -
 46
46 -
 47
47 -
 48
48 -
 49
49 -
50
-
51
-
52
-
53
-
54
-
55
-
56
-
57
-
58
-
59
-
60
-
61
-
62
-
63
-
64
-
65
-
66
-
67
-
68
-
69
-
70
-
71
-
72
-
73
-
74
-
75
-
76
-
77
-
78
-
79
-
80
-
81
-
82
-
83
-
84
-
85
-
86
-
87
-
88
-
89
-
90
-
91
-
92
-
93
-
94
-
95
-
96
-
97
-
98
-
99
-
100
-
101
-
102
-
103
-
104
-
105
-
106
-
107
-
108
-
109
-
110
-
111
-
112
-
113
-
114
-
115
-
116
-
117
-
118
-
119
-
120
-
121
-
122
-
123
-
124
-
125
-
126
-
127
-
128
-
129
-
130
-
131
-
132
-
133
-
134
-
135
-
136
-
137
-
138
-
139
-
140
-
141
-
142
-
143
-
144
-
145
-
146
-
147
-
148
-
149
-
150
-
151
-
152
-
153
-
154
-
155
-
156
-
157
-
158
-
159
-
160
-
161
-
162
-
163
-
164
-
165
-
166
-
167
-
168
-
169
-
170
-
171
-
172
-
173
-
174
-
175
-
176
-
177
-
178
-
179
-
180
-
181
-
182
-
183
-
184
-
185
-
186
-
187
-
188
-
189
-
190
-
191
-
192
-
193
-
194
-
195
-
196
-
197
-
198
-
199
-
200
-
201
-
202
-
203
-
204
-
205
-
206
-
207
-
208
-
209
-
210
-
211
-
212
-
213
-
214
-
215
-
216
-
217
-
218
-
219
-
220
-
221
-
222
-
223
-
224
-
225
-
226
-
227
-
228
-
229
-
230
-
231
-
232
-
233
-
234
-
235
-
236
-
237
-
238
-
239
-
240
-
241
-
242
-
243
-
244
-
245
-
246
-
247
-
248
-
249
-
250
-
251
-
252
-
253
-
254
-
255
-
256
-
257
-
258
-
259
-
260
-
261
-
262
-
263
-
264
-
265
-
266
-
267
-
268
-
269
-
270
-
271
-
272
-
273
-
274
-
275
-
276
-
277
-
278
-
279
-
280
-
281
-
282
-
283
-
284
 |
 |
Bank of America 2013 37
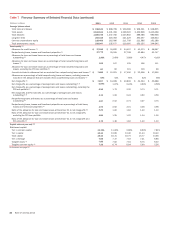
loan balance run-off. Noninterest expense decreased $1.2 billion
primarily due to lower operating expenses in Legacy Assets &
Servicing, partially offset by higher litigation expense.
Home Loans
Home Loans products are available to our customers through our
retail network, direct telephone and online access delivered by a
sales force of 3,200 mortgage loan officers, including 1,700
banking center mortgage loan officers covering nearly 2,500
banking centers, and a 900-person centralized sales force based
in five call centers.
Net income for Home Loans decreased $995 million to a loss
of $118 million driven by a decrease in noninterest income, an
increase in noninterest expense and higher provision for credit
losses. Noninterest income decreased $1.4 billion due to lower
mortgage banking income driven by a decline in core production
revenue as a result of continued industry-wide margin compression
and lower loan application volumes. The provision for credit losses
increased $55 million reflecting a slower rate of credit quality
improvement than in 2012. Noninterest expense increased $123
million primarily due to higher production costs. The higher
production costs were primarily personnel-related as we added
mortgage loan officers earlier in 2013, primarily in banking centers,
and other employees in sales and fulfillment areas in order to
expand capacity and enhance customer service. While staffing
increased in early 2013, total staffing at year end decreased
approximately 21 percent from December 31, 2012 following a
sharp decline in the market demand for mortgages late in 2013,
which is expected to continue into 2014.
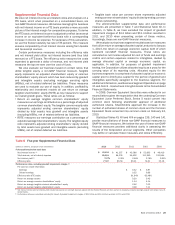
Legacy Assets & Servicing
Legacy Assets & Servicing is responsible for all of our servicing
activities related to the residential mortgage and home equity loan
portfolios, including owned loans and loans serviced for others
(collectively, the mortgage serviced portfolio). A portion of this
portfolio has been designated as the Legacy Serviced Portfolio,
which represented 30 percent, 38 percent and 42 percent of the
total mortgage serviced portfolio, as measured by unpaid principal
balance, at December 31, 2013, 2012 and 2011, respectively.
Legacy Assets & Servicing results reflect the net cost of legacy
exposures that are included in the results of CRES, including
representations and warranties provision, litigation expense,
financial results of the CRES home equity portfolio selected as
part of the Legacy Owned Portfolio, the financial results of the
servicing operations and the results of MSR activities, including
net hedge results. The financial results of the servicing operations
reflect certain revenues and expenses on loans serviced for
others, including owned loans serviced for Home Loans, GWIM
and All Other.
Servicing activities include collecting cash for principal,
interest and escrow payments from borrowers, disbursing
customer draws for lines of credit, accounting for and remitting
principal and interest payments to investors and escrow payments
to third parties, and responding to customer inquiries. Our home
retention efforts, including single point of contact resources, are
also part of our servicing activities, along with the supervision of
foreclosures and property dispositions. In an effort to help our
customers avoid foreclosure, Legacy Assets & Servicing evaluates
various workout options prior to foreclosure which, combined with
legislative changes at the state level and ongoing foreclosure
delays in states where foreclosure requires a court order following
a legal proceeding (judicial states), have resulted in elongated
default timelines. For more information on our servicing activities,
including the impact of foreclosure delays, see Off-Balance Sheet
Arrangements and Contractual Obligations – Servicing,
Foreclosure and Other Mortgage Matters on page 53.
The net loss for Legacy Assets & Servicing decreased $2.3
billion to $5.0 billion driven by a decrease in the provision for credit
losses, a decrease in noninterest expense and an increase in
noninterest income. Noninterest income increased $380 million
due to lower representations and warranties provision, largely
offset by lower servicing income primarily driven by a decline in
the servicing portfolio, less favorable MSR net-of-hedge
performance and the divestiture of an ancillary servicing business
in 2012. The provision for credit losses decreased $1.7 billion to
a benefit of $283 million primarily driven by improved
delinquencies, increased home prices and continued loan balance
run-off.
Noninterest expense decreased $1.3 billion primarily due to a
$1.6 billion decrease in default-related staffing and other default-
related servicing expenses, lower costs as a result of the
divestiture of an ancillary servicing business in 2012 and lower
mortgage-related assessments, waivers and similar costs related
to foreclosure delays. Noninterest expense in 2012 included a
$1.1 billion provision for the 2013 IFR Acceleration Agreement.
These improvements were partially offset by an increase of $2.2
billion in litigation expense driven by residential mortgage-backed
securities (RMBS) exposures and the settlement with MBIA Inc.
and certain of its affiliates (MBIA) in 2013 (the MBIA Settlement).
For more information on the 2013 IFR Acceleration Agreement,
see Off-Balance Sheet Arrangements and Contractual Obligations
on page 48 and for more information on RMBS litigation, see Note
12 – Commitments and Contingencies to the Consolidated Financial
Statements. We expect noninterest expense in Legacy Assets &
Servicing, excluding litigation, to decrease to approximately $1.1
billion per quarter by the fourth quarter of 2014 compared to $1.8
billion during the fourth quarter of 2013.
Legacy Portfolios
The Legacy Portfolios (both owned and serviced) include those
loans originated prior to January 1, 2011 that would not have been
originated under our established underwriting standards in place
as of December 31, 2010. The purchased credit-impaired (PCI)
portfolios as well as certain loans that met a pre-defined
delinquency status or probability of default threshold as of January
1, 2011 are also included in the Legacy Portfolios. Since
determining the pool of loans to be included in the Legacy Portfolios
as of January 1, 2011, the criteria have not changed for these
portfolios, but will continue to be evaluated over time.
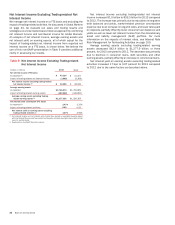
Legacy Owned Portfolio
The Legacy Owned Portfolio includes those loans that met the
criteria as described above and are on the balance sheet of the
Corporation. The home equity loan portfolio is held on the balance
sheet of Legacy Assets & Servicing, and the residential mortgage
loan portfolio is held on the balance sheet of All Other. The financial
results of the on-balance sheet loans are reported in the segment
that owns the loans or in All Other. Total loans in the Legacy Owned
Portfolio decreased $19.0 billion in 2013 to $112.1 billion at
December 31, 2013, of which $38.7 billion was held on the Legacy
Assets & Servicing balance sheet and the remainder was held on
the balance sheet of All Other. The decrease was primarily related