Bank of America 2013 Annual Report Download - page 101
Download and view the complete annual report
Please find page 101 of the 2013 Bank of America annual report below. You can navigate through the pages in the report by either clicking on the pages listed below, or by using the keyword search tool below to find specific information within the annual report.-
 1
1 -
2
-
3
-
4
-
5
-
6
-
7
-
8
-
9
-
10
-
11
-
12
-
13
-
14
-
15
-
16
-
17
-
18
-
19
-
20
-
21
-
22
-
23
-
24
-
25
-
26
-
27
-
28
-
29
-
30
-
31
-
32
-
33
-
34
-
35
-
36
-
37
-
38
-
39
-
40
-
41
-
42
-
43
-
44
-
45
-
46
-
47
-
48
-
49
-
50
-
51
-
52
-
53
-
54
-
55
-
56
-
57
-
58
-
59
-
60
-
61
-
62
-
63
-
64
-
65
-
66
-
67
-
68
-
69
-
70
-
71
-
72
-
73
-
74
-
75
-
76
-
77
-
78
-
79
-
80
-
81
-
82
-
83
-
84
-
85
-
86
-
87
-
88
-
89
-
90
-
 91
91 -
 92
92 -
 93
93 -
 94
94 -
 95
95 -
 96
96 -
 97
97 -
 98
98 -
 99
99 -
 100
100 -
 101
101 -
 102
102 -
 103
103 -
 104
104 -
 105
105 -
 106
106 -
 107
107 -
 108
108 -
 109
109 -
 110
110 -
 111
111 -
112
-
113
-
114
-
115
-
116
-
117
-
118
-
119
-
120
-
121
-
122
-
123
-
124
-
125
-
126
-
127
-
128
-
129
-
130
-
131
-
132
-
133
-
134
-
135
-
136
-
137
-
138
-
139
-
140
-
141
-
142
-
143
-
144
-
145
-
146
-
147
-
148
-
149
-
150
-
151
-
152
-
153
-
154
-
155
-
156
-
157
-
158
-
159
-
160
-
161
-
162
-
163
-
164
-
165
-
166
-
167
-
168
-
169
-
170
-
171
-
172
-
173
-
174
-
175
-
176
-
177
-
178
-
179
-
180
-
181
-
182
-
183
-
184
-
185
-
186
-
187
-
188
-
189
-
190
-
191
-
192
-
193
-
194
-
195
-
196
-
197
-
198
-
199
-
200
-
201
-
202
-
203
-
204
-
205
-
206
-
207
-
208
-
209
-
210
-
211
-
212
-
213
-
214
-
215
-
216
-
217
-
218
-
219
-
220
-
221
-
222
-
223
-
224
-
225
-
226
-
227
-
228
-
229
-
230
-
231
-
232
-
233
-
234
-
235
-
236
-
237
-
238
-
239
-
240
-
241
-
242
-
243
-
244
-
245
-
246
-
247
-
248
-
249
-
250
-
251
-
252
-
253
-
254
-
255
-
256
-
257
-
258
-
259
-
260
-
261
-
262
-
263
-
264
-
265
-
266
-
267
-
268
-
269
-
270
-
271
-
272
-
273
-
274
-
275
-
276
-
277
-
278
-
279
-
280
-
281
-
282
-
283
-
284
 |
 |

Bank of America 2013 99
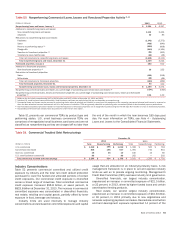
Table 62 presents the notional amount and fair value of single-
name CDS purchased and sold on reference assets in Greece,
Ireland, Italy, Portugal and Spain. Table 62 includes only single-
name CDS netted at the counterparty level, whereas, Table 61
includes single-name, indexed and tranched CDS exposures
netted by the reference asset that they are intended to hedge;
therefore, CDS purchased and sold information is not comparable
between tables.
Table 62 Single-Name CDS with Reference Assets in
Greece, Ireland, Italy, Portugal and Spain (1)
December 31, 2013
Notional Fair Value
(Dollars in billions) Purchased Sold Purchased Sold
Greece
Aggregate $ 1.4 $ 1.4 $ 0.1 $ 0.1
After legally netting (2) 0.3 0.3 — —
Ireland
Aggregate 2.4 2.2 0.1 0.1
After legally netting (2) 0.9 0.7 0.1 —
Italy
Aggregate 53.8 47.9 2.5 1.7
After legally netting (2) 13.0 7.0 1.1 0.4
Portugal
Aggregate 7.5 7.5 0.4 0.4
After legally netting (2) 1.2 1.3 0.1 0.1
Spain
Aggregate 20.7 20.8 0.6 0.6
After legally netting (2) 3.2 3.2 0.1 0.1
(1) The majority of our CDS contracts on reference assets in Greece, Ireland, Italy, Portugal and
Spain are primarily with non-Eurozone counterparties.
(2) Amounts listed are after consideration of legally enforceable counterparty master netting
agreements.
Losses could result even if there is credit default protection
purchased because the purchased credit protection contracts may
only pay out under certain scenarios and thus not all losses may
be covered by the credit protection contracts. The effectiveness
of our CDS protection as a hedge of these risks is influenced by
a number of factors, including the contractual terms of the CDS.
Generally, only the occurrence of a credit event as defined by the
CDS terms (which may include, among other events, the failure to
pay by, or restructuring of, the reference entity) results in a payment
under the purchased credit protection contracts. The
determination as to whether a credit event has occurred is made
by the relevant International Swaps and Derivatives Association,
Inc. (ISDA) Determination Committee (comprised of various ISDA
member firms) based on the terms of the CDS and facts and
circumstances for the event. Accordingly, uncertainties exist as to
whether any particular strategy or policy action for addressing the
European financial instability would constitute a credit event under
the CDS. A voluntary restructuring may not trigger a credit event
under CDS terms and consequently may not trigger a payment
under the CDS contract.
In addition to our direct sovereign and non-sovereign exposures,
a significant deterioration of the European financial instability
could result in material reductions in the value of sovereign debt
and other asset classes posted as collateral, disruptions in capital
markets, widening of credit spreads of U.S. and non-U.S. financial
institutions, loss of investor confidence in the financial services
industry, a slowdown in global economic activity and other adverse
developments. For more information on the financial instability in
Europe, see Item 1A. Risk Factors of this Annual Report on Form
10-K.
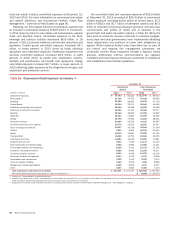
Table 63 presents countries where total cross-border exposure
exceeded one percent of our total assets. At December 31, 2013,
the United Kingdom was the only country where total cross-border
exposure exceeded one percent of our total assets. At
December 31, 2013, France had total cross-border exposure of
$17.8 billion representing 0.85 percent of our total assets. No
other countries had total cross-border exposure that exceeded
0.75 percent of our total assets at December 31, 2013.
Table 63 Total Cross-border Exposure Exceeding One
Percent of Total Assets
United Kingdom
(Dollars in millions) 2013 2012
Public sector $6
$ 95
Banks 7,027 5,656
Private sector 32,466 31,595
Cross-border exposure $ 39,499 $ 37,346
Exposure as a percentage of total assets 1.88% 1.69%
Cross-border exposures are calculated using FFIEC guidelines
and not our internal risk management view; therefore, exposures
are not comparable between tables. Exposure includes cross-
border claims by our non-U.S. offices including loans,
acceptances, time deposits placed, trading account assets,
securities, derivative assets, other interest-earning investments
and other monetary assets. Amounts also include unfunded
commitments, letters of credit and financial guarantees, and the
notional amount of cash lent under secured financing transactions.
Sector definitions are consistent with FFIEC reporting
requirements for preparing the Country Exposure Report.