Bank of America 2013 Annual Report Download - page 45
Download and view the complete annual report
Please find page 45 of the 2013 Bank of America annual report below. You can navigate through the pages in the report by either clicking on the pages listed below, or by using the keyword search tool below to find specific information within the annual report.-
 1
1 -
2
-
3
-
4
-
5
-
6
-
7
-
8
-
9
-
10
-
11
-
12
-
13
-
14
-
15
-
16
-
17
-
18
-
19
-
20
-
21
-
22
-
23
-
24
-
25
-
26
-
27
-
28
-
29
-
30
-
31
-
32
-
33
-
34
-
 35
35 -
 36
36 -
 37
37 -
 38
38 -
 39
39 -
 40
40 -
 41
41 -
 42
42 -
 43
43 -
 44
44 -
 45
45 -
 46
46 -
 47
47 -
 48
48 -
 49
49 -
 50
50 -
 51
51 -
 52
52 -
 53
53 -
 54
54 -
 55
55 -
56
-
57
-
58
-
59
-
60
-
61
-
62
-
63
-
64
-
65
-
66
-
67
-
68
-
69
-
70
-
71
-
72
-
73
-
74
-
75
-
76
-
77
-
78
-
79
-
80
-
81
-
82
-
83
-
84
-
85
-
86
-
87
-
88
-
89
-
90
-
91
-
92
-
93
-
94
-
95
-
96
-
97
-
98
-
99
-
100
-
101
-
102
-
103
-
104
-
105
-
106
-
107
-
108
-
109
-
110
-
111
-
112
-
113
-
114
-
115
-
116
-
117
-
118
-
119
-
120
-
121
-
122
-
123
-
124
-
125
-
126
-
127
-
128
-
129
-
130
-
131
-
132
-
133
-
134
-
135
-
136
-
137
-
138
-
139
-
140
-
141
-
142
-
143
-
144
-
145
-
146
-
147
-
148
-
149
-
150
-
151
-
152
-
153
-
154
-
155
-
156
-
157
-
158
-
159
-
160
-
161
-
162
-
163
-
164
-
165
-
166
-
167
-
168
-
169
-
170
-
171
-
172
-
173
-
174
-
175
-
176
-
177
-
178
-
179
-
180
-
181
-
182
-
183
-
184
-
185
-
186
-
187
-
188
-
189
-
190
-
191
-
192
-
193
-
194
-
195
-
196
-
197
-
198
-
199
-
200
-
201
-
202
-
203
-
204
-
205
-
206
-
207
-
208
-
209
-
210
-
211
-
212
-
213
-
214
-
215
-
216
-
217
-
218
-
219
-
220
-
221
-
222
-
223
-
224
-
225
-
226
-
227
-
228
-
229
-
230
-
231
-
232
-
233
-
234
-
235
-
236
-
237
-
238
-
239
-
240
-
241
-
242
-
243
-
244
-
245
-
246
-
247
-
248
-
249
-
250
-
251
-
252
-
253
-
254
-
255
-
256
-
257
-
258
-
259
-
260
-
261
-
262
-
263
-
264
-
265
-
266
-
267
-
268
-
269
-
270
-
271
-
272
-
273
-
274
-
275
-
276
-
277
-
278
-
279
-
280
-
281
-
282
-
283
-
284
 |
 |

Bank of America 2013 43
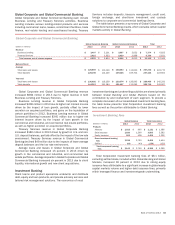
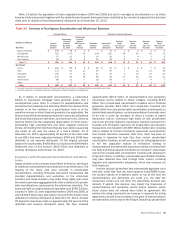
Global Corporate and Global Commercial Banking
Global Corporate and Global Commercial Banking each include
Business Lending and Treasury Services activities. Business
Lending includes various lending-related products and services
including commercial loans, leases, commitment facilities, trade
finance, real estate lending and asset-based lending. Treasury
Services includes deposits, treasury management, credit card,
foreign exchange, and short-term investment and custody
solutions to corporate and commercial banking clients.
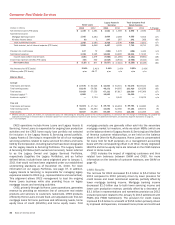
The table below presents a summary of Global Corporate and
Global Commercial Banking results, which excludes certain capital
markets activity in Global Banking.
Global Corporate and Global Commercial Banking
Global Corporate Banking Global Commercial Banking Total
(Dollars in millions) 2013 2012 2013 2012 2013 2012
Revenue
Business Lending $ 3,407 $ 3,201 $ 3,967 $ 3,622 $ 7,374 $ 6,823
Treasury Services 2,815 2,633 2,939 2,988 5,754 5,621
Total revenue, net of interest expense $ 6,222 $ 5,834 $ 6,906 $ 6,610 $13,128 $ 12,444
Balance Sheet
Average
Total loans and leases $ 126,669 $110,130 $ 130,563 $113,640 $ 257,232 $ 223,770
Total deposits 128,198 114,200 109,225 109,704 237,423 223,904
Year end
Total loans and leases $ 130,092 $116,239 $ 139,374 $126,093 $ 269,466 $ 242,332
Total deposits 144,312 131,184 121,407 112,083 265,719 243,267
Global Corporate and Global Commercial Banking revenue
increased $684 million in 2013 due to higher revenue in both
Business Lending and Treasury Services.
Business Lending revenue in Global Corporate Banking
increased $206 million in 2013 due to higher net interest income
driven by the impact of loan growth, partially offset by lower
accretion on acquired portfolios, and gains on the liquidation of
certain portfolios in 2012. Business Lending revenue in Global
Commercial Banking increased $345 million due to higher net
interest income driven by the impact of loan growth in the
commercial and industrial, and commercial real estate portfolios,
as well as higher accretion on acquired portfolios.
Treasury Services revenue in Global Corporate Banking
increased $182 million in 2013 driven by growth in U.S. and non-
U.S. deposit balances, partially offset by the impact of the low rate
environment. Treasury Services revenue in Global Commercial
Banking declined $49 million due to the impacts of lower average
deposit balances and the low rate environment.
Average loans and leases in Global Corporate and Global
Commercial Banking increased 15 percent in 2013 driven by
growth in the commercial and industrial, and commercial real
estate portfolios. Average deposits in Global Corporate and Global
Commercial Banking increased six percent in 2013 due to client
liquidity, international growth and new client acquisitions.
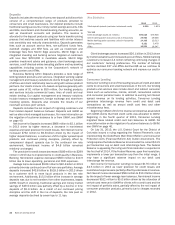
Investment Banking
Client teams and product specialists underwrite and distribute
debt, equity and loan products, and provide advisory services and
tailored risk management solutions. The economics of most
investment banking and underwriting activities are shared primarily
between Global Banking and Global Markets based on the
contribution by and involvement of each segment. To provide a
complete discussion of our consolidated investment banking fees,
the table below presents total Corporation investment banking
fees as well as the portion attributable to Global Banking.
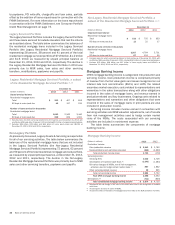
Investment Banking Fees
Global Banking Total Corporation
(Dollars in millions) 2013 2012 2013 2012
Products
Advisory $ 1,022 $ 995 $ 1,131 $ 1,066
Debt issuance 1,620 1,390 3,805 3,362
Equity issuance 593 408 1,469 1,026
Gross investment banking
fees 3,235 2,793 6,405 5,454
Self-led (92) (43) (279) (155)
Total investment banking
fees $ 3,143 $ 2,750 $ 6,126 $ 5,299
Total Corporation investment banking fees of $6.1 billion,
excluding self-led deals, included within Global Banking and Global
Markets, increased 16 percent in 2013 due to strong equity
issuance fees attributable to a significant increase in global equity
capital markets volume and higher debt issuance fees, primarily
within leveraged finance and investment-grade underwriting.