Bank of America 2013 Annual Report Download - page 35
Download and view the complete annual report
Please find page 35 of the 2013 Bank of America annual report below. You can navigate through the pages in the report by either clicking on the pages listed below, or by using the keyword search tool below to find specific information within the annual report.-
 1
1 -
2
-
3
-
4
-
5
-
6
-
7
-
8
-
9
-
10
-
11
-
12
-
13
-
14
-
15
-
16
-
17
-
18
-
19
-
20
-
21
-
22
-
23
-
24
-
 25
25 -
 26
26 -
 27
27 -
 28
28 -
 29
29 -
 30
30 -
 31
31 -
 32
32 -
 33
33 -
 34
34 -
 35
35 -
 36
36 -
 37
37 -
 38
38 -
 39
39 -
 40
40 -
 41
41 -
 42
42 -
 43
43 -
 44
44 -
 45
45 -
46
-
47
-
48
-
49
-
50
-
51
-
52
-
53
-
54
-
55
-
56
-
57
-
58
-
59
-
60
-
61
-
62
-
63
-
64
-
65
-
66
-
67
-
68
-
69
-
70
-
71
-
72
-
73
-
74
-
75
-
76
-
77
-
78
-
79
-
80
-
81
-
82
-
83
-
84
-
85
-
86
-
87
-
88
-
89
-
90
-
91
-
92
-
93
-
94
-
95
-
96
-
97
-
98
-
99
-
100
-
101
-
102
-
103
-
104
-
105
-
106
-
107
-
108
-
109
-
110
-
111
-
112
-
113
-
114
-
115
-
116
-
117
-
118
-
119
-
120
-
121
-
122
-
123
-
124
-
125
-
126
-
127
-
128
-
129
-
130
-
131
-
132
-
133
-
134
-
135
-
136
-
137
-
138
-
139
-
140
-
141
-
142
-
143
-
144
-
145
-
146
-
147
-
148
-
149
-
150
-
151
-
152
-
153
-
154
-
155
-
156
-
157
-
158
-
159
-
160
-
161
-
162
-
163
-
164
-
165
-
166
-
167
-
168
-
169
-
170
-
171
-
172
-
173
-
174
-
175
-
176
-
177
-
178
-
179
-
180
-
181
-
182
-
183
-
184
-
185
-
186
-
187
-
188
-
189
-
190
-
191
-
192
-
193
-
194
-
195
-
196
-
197
-
198
-
199
-
200
-
201
-
202
-
203
-
204
-
205
-
206
-
207
-
208
-
209
-
210
-
211
-
212
-
213
-
214
-
215
-
216
-
217
-
218
-
219
-
220
-
221
-
222
-
223
-
224
-
225
-
226
-
227
-
228
-
229
-
230
-
231
-
232
-
233
-
234
-
235
-
236
-
237
-
238
-
239
-
240
-
241
-
242
-
243
-
244
-
245
-
246
-
247
-
248
-
249
-
250
-
251
-
252
-
253
-
254
-
255
-
256
-
257
-
258
-
259
-
260
-
261
-
262
-
263
-
264
-
265
-
266
-
267
-
268
-
269
-
270
-
271
-
272
-
273
-
274
-
275
-
276
-
277
-
278
-
279
-
280
-
281
-
282
-
283
-
284
 |
 |

Bank of America 2013 33
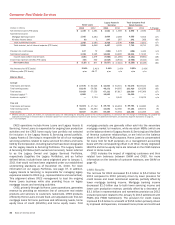
Consumer & Business Banking
Deposits
Consumer
Lending
Total Consumer &
Business Banking
(Dollars in millions) 2013 2012 2013 2012 2013 2012 % Change
Net interest income (FTE basis) $ 9,808 $ 9,046 $ 10,243 $ 10,807 $20,051 $ 19,853 1%
Noninterest income:
Card income 60 62 4,744 5,253 4,804 5,315 (10)
Service charges 4,208 4,277 ——4,208 4,277 (2)
All other income (loss) 509 397 295 (52) 804 345 133
Total noninterest income 4,777 4,736 5,039 5,201 9,816 9,937 (1)
Total revenue, net of interest expense (FTE basis) 14,585 13,782 15,282 16,008 29,867 29,790 —
Provision for credit losses 299 488 2,808 3,660 3,107 4,148 (25)
Noninterest expense 10,927 11,310 5,430 5,685 16,357 16,995 (4)
Income before income taxes 3,359 1,984 7,044 6,663 10,403 8,647 20
Income tax expense (FTE basis) 1,232 723 2,583 2,378 3,815 3,101 23
Net income $ 2,127 $ 1,261 $ 4,461 $ 4,285 $ 6,588 $ 5,546 19
Net interest yield (FTE basis) 1.88% 1.90% 7.18%7.18% 3.72%4.04%
Return on average allocated capital (1) 13.82 —30.60 —21.98 —
Return on average economic capital (1) —9.72 —38.83 —23.12
Efficiency ratio (FTE basis) 74.92 82.07 35.53 35.51 54.76 57.05
Balance Sheet
Average
Total loans and leases $ 22,437 $ 23,369 $ 142,133 $149,667 $ 164,570 $173,036 (5)
Total earning assets (2) 522,870 477,142 142,725 150,515 539,213 491,767 10
Total assets (2) 555,653 510,384 151,443 158,333 580,714 532,827 9
Total deposits 518,470 474,822 n/m n/m 518,980 475,180 9
Allocated capital (1) 15,400 —14,600 —30,000 — n/m
Economic capital (1) —12,985 —11,066 —24,051 n/m
Year end
Total loans and leases $ 22,574 $ 22,907 $ 142,516 $146,359 $ 165,090 $169,266 (2)
Total earning assets (2) 534,946 498,147 143,917 146,809 550,610 513,109 7
Total assets (2) 567,837 531,354 153,394 155,408 592,978 554,915 7
Total deposits 530,947 495,711 n/m n/m 531,707 496,159 7
(1) Effective January 1, 2013, we revised, on a prospective basis, the methodology for allocating capital to the business segments. In connection with the change in methodology, we updated the
applicable terminology in the above table to allocated capital from economic capital as reported in prior periods. For additional information, see Business Segment Operations on page 31.
(2) For presentation purposes, in segments and businesses where the total of liabilities and equity exceeds assets, we allocate assets from All Other to match the segments’ and businesses’ liabilities
and allocated shareholders’ equity. As a result, total earning assets and total assets of the businesses may not equal total CBB.
n/m = not meaningful
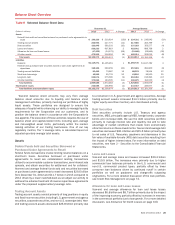
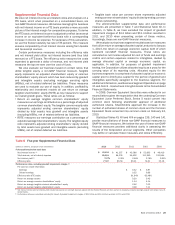
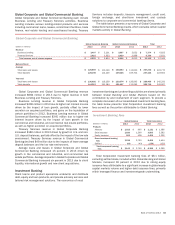
CBB, which is comprised of Deposits and Consumer Lending,
offers a diversified range of credit, banking and investment
products and services to consumers and businesses. Our
customers and clients have access to a franchise network that
stretches coast to coast through 31 states and the District of
Columbia. The franchise network includes approximately 5,100
banking centers, 16,300 ATMs, nationwide call centers, and online
and mobile platforms. During 2013, Business Banking results
were moved into Deposits as we continue to integrate these
businesses. Also during 2013, consumer Dealer Financial
Services (DFS) results were moved into CBB from Global Banking
to align this business more closely with our consumer lending
activity and better serve the needs of our customers. As a result,
Card Services was renamed Consumer Lending. Prior periods were
reclassified to conform to current period presentation.
CBB Results
Net income for CBB increased $1.0 billion to $6.6 billion in 2013
compared to 2012 primarily driven by lower provision for credit
losses and noninterest expense. Net interest income of $20.1
billion remained relatively unchanged as the impact of higher
deposit balances was offset by the impact of lower average loan
balances. Noninterest income of $9.8 billion remained relatively
unchanged as the allocation of certain card revenue to GWIM for
clients with a credit card, as described below, and lower deposit
service charges were offset by the net impact of consumer
protection products, primarily due to charges recorded in 2012.
The provision for credit losses decreased $1.0 billion to $3.1
billion in 2013 primarily as a result of improvements in credit
quality. Noninterest expense decreased $638 million to $16.4
billion driven by lower operating, personnel and FDIC expenses.