Bank of America 2013 Annual Report Download - page 267
Download and view the complete annual report
Please find page 267 of the 2013 Bank of America annual report below. You can navigate through the pages in the report by either clicking on the pages listed below, or by using the keyword search tool below to find specific information within the annual report.-
 1
1 -
2
-
3
-
4
-
5
-
6
-
7
-
8
-
9
-
10
-
11
-
12
-
13
-
14
-
15
-
16
-
17
-
18
-
19
-
20
-
21
-
22
-
23
-
24
-
25
-
26
-
27
-
28
-
29
-
30
-
31
-
32
-
33
-
34
-
35
-
36
-
37
-
38
-
39
-
40
-
41
-
42
-
43
-
44
-
45
-
46
-
47
-
48
-
49
-
50
-
51
-
52
-
53
-
54
-
55
-
56
-
57
-
58
-
59
-
60
-
61
-
62
-
63
-
64
-
65
-
66
-
67
-
68
-
69
-
70
-
71
-
72
-
73
-
74
-
75
-
76
-
77
-
78
-
79
-
80
-
81
-
82
-
83
-
84
-
85
-
86
-
87
-
88
-
89
-
90
-
91
-
92
-
93
-
94
-
95
-
96
-
97
-
98
-
99
-
100
-
101
-
102
-
103
-
104
-
105
-
106
-
107
-
108
-
109
-
110
-
111
-
112
-
113
-
114
-
115
-
116
-
117
-
118
-
119
-
120
-
121
-
122
-
123
-
124
-
125
-
126
-
127
-
128
-
129
-
130
-
131
-
132
-
133
-
134
-
135
-
136
-
137
-
138
-
139
-
140
-
141
-
142
-
143
-
144
-
145
-
146
-
147
-
148
-
149
-
150
-
151
-
152
-
153
-
154
-
155
-
156
-
157
-
158
-
159
-
160
-
161
-
162
-
163
-
164
-
165
-
166
-
167
-
168
-
169
-
170
-
171
-
172
-
173
-
174
-
175
-
176
-
177
-
178
-
179
-
180
-
181
-
182
-
183
-
184
-
185
-
186
-
187
-
188
-
189
-
190
-
191
-
192
-
193
-
194
-
195
-
196
-
197
-
198
-
199
-
200
-
201
-
202
-
203
-
204
-
205
-
206
-
207
-
208
-
209
-
210
-
211
-
212
-
213
-
214
-
215
-
216
-
217
-
218
-
219
-
220
-
221
-
222
-
223
-
224
-
225
-
226
-
227
-
228
-
229
-
230
-
231
-
232
-
233
-
234
-
235
-
236
-
237
-
238
-
239
-
240
-
241
-
242
-
243
-
244
-
245
-
246
-
247
-
248
-
249
-
250
-
251
-
252
-
253
-
254
-
255
-
256
-
 257
257 -
 258
258 -
 259
259 -
 260
260 -
 261
261 -
 262
262 -
 263
263 -
 264
264 -
 265
265 -
 266
266 -
 267
267 -
 268
268 -
 269
269 -
 270
270 -
 271
271 -
 272
272 -
 273
273 -
 274
274 -
 275
275 -
 276
276 -
 277
277 -
278
-
279
-
280
-
281
-
282
-
283
-
284
 |
 |

Bank of America 2013 265
Sensitivity of Fair Value Measurements to Changes in
Unobservable Inputs
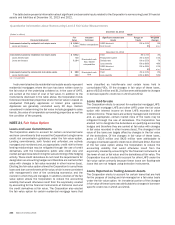
Loans and Securities
For instruments backed by residential real estate assets,
commercial real estate assets, and commercial loans, debt
securities and other, a significant increase in market yields, default
rates, loss severities or duration would result in a significantly
lower fair value for long positions. Short positions would be
impacted in a directionally opposite way. The impact of changes
in prepayment speeds would have differing impacts depending on
the seniority of the instrument and, in the case of CLOs, whether
prepayments can be reinvested.
For closed-end auction rate securities (ARS), a significant
increase in discount rates would result in a significantly lower fair
value. For student loan and municipal ARS, a significant increase
in projected tender price/refinancing levels would result in a
significantly higher fair value.
Structured Liabilities and Derivatives
For credit derivatives, a significant increase in market yield,
including spreads to indices, upfront points (i.e., a single upfront
payment made by a protection buyer at inception), credit spreads,
default rates or loss severities would result in a significantly lower
fair value for protection sellers and higher fair value for protection
buyers. The impact of changes in prepayment speeds would have
differing impacts depending on the seniority of the instrument and,
in the case of CLOs, whether prepayments can be reinvested.
Structured credit derivatives, which include tranched portfolio
CDS and derivatives with derivative product company (DPC) and
monoline counterparties, are impacted by credit correlation,
including default and wrong-way correlation. Default correlation is
a parameter that describes the degree of dependence among
credit default rates within a credit portfolio that underlies a credit
derivative instrument. The sensitivity of this input on the fair value
varies depending on the level of subordination of the tranche. For
senior tranches that are net purchases of protection, a significant
increase in default correlation would result in a significantly higher
fair value. Net short protection positions would be impacted in a
directionally opposite way. Wrong-way correlation is a parameter
that describes the probability that, as exposure to a counterparty
increases, the credit quality of the counterparty decreases. A
significantly higher degree of wrong-way correlation between a DPC
counterparty and underlying derivative exposure would result in a
significantly lower fair value.
For equity derivatives, interest rate derivatives and structured
liabilities, a significant change in long-dated rates and volatilities
and correlation inputs (e.g., the degree of correlation between an
equity security and an index, between two different interest rates,
or between interest rates and foreign exchange rates) would result
in a significant impact to the fair value; however, the magnitude
and direction of the impact depends on whether the Corporation
is long or short the exposure.
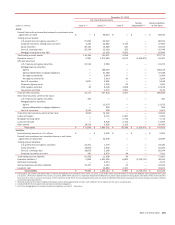
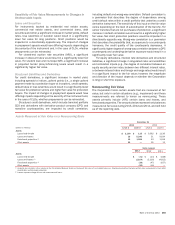
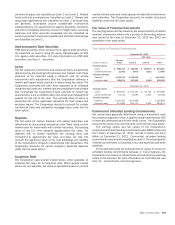
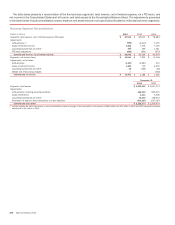
Nonrecurring Fair Value
The Corporation holds certain assets that are measured at fair
value, but only in certain situations (e.g., impairment) and these
measurements are referred to herein as nonrecurring. These
assets primarily include LHFS, certain loans and leases, and
foreclosed properties. The amounts below represent only balances
measured at fair value during 2013, 2012 and 2011, and still held
as of the reporting date.
Assets Measured at Fair Value on a Nonrecurring Basis
December 31
2013 2012
(Dollars in millions) Level 2 Level 3 Level 2 Level 3
Assets
Loans held-for-sale $ 2,138 $ 115 $ 5,692 $ 1,136
Loans and leases 18 5,240 21 9,184
Foreclosed properties (1) 12 1,258 33 1,918
Other assets 88 —36 12
Gains (Losses)
2013 2012 2011
Assets
Loans held-for-sale $(71)
$ (24) $ (188)
Loans and leases (2) (1,104)(3,116) (4,813)
Foreclosed properties (1) (39) (47) (167)
Other assets (20) (16) —
(1) Amounts are included in other assets on the Consolidated Balance Sheet and represent fair value of, and related losses on, foreclosed properties that were written down subsequent to their initial
classification as foreclosed properties.
(2) Losses represent charge-offs on real estate-secured loans.