Bank of America 2013 Annual Report Download - page 185
Download and view the complete annual report
Please find page 185 of the 2013 Bank of America annual report below. You can navigate through the pages in the report by either clicking on the pages listed below, or by using the keyword search tool below to find specific information within the annual report.-
 1
1 -
2
-
3
-
4
-
5
-
6
-
7
-
8
-
9
-
10
-
11
-
12
-
13
-
14
-
15
-
16
-
17
-
18
-
19
-
20
-
21
-
22
-
23
-
24
-
25
-
26
-
27
-
28
-
29
-
30
-
31
-
32
-
33
-
34
-
35
-
36
-
37
-
38
-
39
-
40
-
41
-
42
-
43
-
44
-
45
-
46
-
47
-
48
-
49
-
50
-
51
-
52
-
53
-
54
-
55
-
56
-
57
-
58
-
59
-
60
-
61
-
62
-
63
-
64
-
65
-
66
-
67
-
68
-
69
-
70
-
71
-
72
-
73
-
74
-
75
-
76
-
77
-
78
-
79
-
80
-
81
-
82
-
83
-
84
-
85
-
86
-
87
-
88
-
89
-
90
-
91
-
92
-
93
-
94
-
95
-
96
-
97
-
98
-
99
-
100
-
101
-
102
-
103
-
104
-
105
-
106
-
107
-
108
-
109
-
110
-
111
-
112
-
113
-
114
-
115
-
116
-
117
-
118
-
119
-
120
-
121
-
122
-
123
-
124
-
125
-
126
-
127
-
128
-
129
-
130
-
131
-
132
-
133
-
134
-
135
-
136
-
137
-
138
-
139
-
140
-
141
-
142
-
143
-
144
-
145
-
146
-
147
-
148
-
149
-
150
-
151
-
152
-
153
-
154
-
155
-
156
-
157
-
158
-
159
-
160
-
161
-
162
-
163
-
164
-
165
-
166
-
167
-
168
-
169
-
170
-
171
-
172
-
173
-
174
-
 175
175 -
 176
176 -
 177
177 -
 178
178 -
 179
179 -
 180
180 -
 181
181 -
 182
182 -
 183
183 -
 184
184 -
 185
185 -
 186
186 -
 187
187 -
 188
188 -
 189
189 -
 190
190 -
 191
191 -
 192
192 -
 193
193 -
 194
194 -
 195
195 -
196
-
197
-
198
-
199
-
200
-
201
-
202
-
203
-
204
-
205
-
206
-
207
-
208
-
209
-
210
-
211
-
212
-
213
-
214
-
215
-
216
-
217
-
218
-
219
-
220
-
221
-
222
-
223
-
224
-
225
-
226
-
227
-
228
-
229
-
230
-
231
-
232
-
233
-
234
-
235
-
236
-
237
-
238
-
239
-
240
-
241
-
242
-
243
-
244
-
245
-
246
-
247
-
248
-
249
-
250
-
251
-
252
-
253
-
254
-
255
-
256
-
257
-
258
-
259
-
260
-
261
-
262
-
263
-
264
-
265
-
266
-
267
-
268
-
269
-
270
-
271
-
272
-
273
-
274
-
275
-
276
-
277
-
278
-
279
-
280
-
281
-
282
-
283
-
284
 |
 |

Bank of America 2013 183
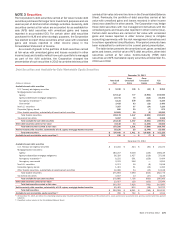
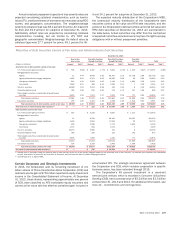
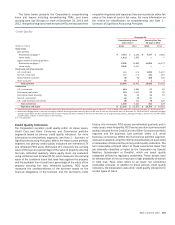
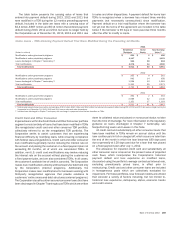
The table below presents the Corporation’s nonperforming
loans and leases including nonperforming TDRs, and loans
accruing past due 90 days or more at December 31, 2013 and
2012. Nonperforming loans held-for-sale (LHFS) are excluded from
nonperforming loans and leases as they are recorded at either fair
value or the lower of cost or fair value. For more information on
the criteria for classification as nonperforming, see Note 1 –
Summary of Significant Accounting Principles.
Credit Quality
December 31
Nonperforming Loans
and Leases (1)
Accruing Past Due
90 Days or More
(Dollars in millions) 2013 2012 2013 2012
Home loans
Core portfolio
Residential mortgage (2) $ 3,316 $ 3,193 $ 5,137 $ 3,984
Home equity 1,431 1,265 ——
Legacy Assets & Servicing portfolio
Residential mortgage (2) 8,396 11,862 11,824 18,173
Home equity 2,644 3,017 ——
Credit card and other consumer
U.S. credit card n/a n/a 1,053 1,437
Non-U.S. credit card n/a n/a 131 212
Direct/Indirect consumer 35 92 408 545
Other consumer 18 222
Total consumer 15,840 19,431 18,555 24,353
Commercial
U.S. commercial 819 1,484 47 65
Commercial real estate 322 1,513 21 29
Commercial lease financing 16 44 41 15
Non-U.S. commercial 64 68 17 —
U.S. small business commercial 88 115 78 120
Total commercial 1,309 3,224 204 229
Total loans and leases $ 17,149 $ 22,655 $18,759 $ 24,582
(1) Nonperforming loan balances do not include nonaccruing TDRs removed from the PCI loan portfolio prior to January 1, 2010 of $260 million and $521 million at December 31, 2013 and 2012.
(2) Residential mortgage loans in the Core and Legacy Assets & Servicing portfolios accruing past due 90 days or more are fully-insured loans. At December 31, 2013 and 2012, residential mortgage
includes $13.0 billion and $17.8 billion of loans on which interest has been curtailed by the FHA, and therefore are no longer accruing interest, although principal is still insured, and $4.0 billion
and $4.4 billion of loans on which interest is still accruing.
n/a = not applicable
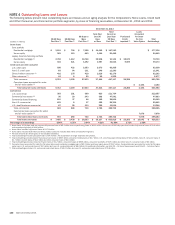
Credit Quality Indicators
The Corporation monitors credit quality within its Home Loans,
Credit Card and Other Consumer, and Commercial portfolio
segments based on primary credit quality indicators. For more
information on the portfolio segments, see Note 1 – Summary of
Significant Accounting Principles. Within the Home Loans portfolio
segment, the primary credit quality indicators are refreshed LTV
and refreshed FICO score. Refreshed LTV measures the carrying
value of the loan as a percentage of the value of property securing
the loan, refreshed quarterly. Home equity loans are evaluated
using combined loan-to-value (CLTV) which measures the carrying
value of the combined loans that have liens against the property
and the available line of credit as a percentage of the value of the
property securing the loan, refreshed quarterly. FICO score
measures the creditworthiness of the borrower based on the
financial obligations of the borrower and the borrower’s credit
history. At a minimum, FICO scores are refreshed quarterly, and in
many cases, more frequently. FICO scores are also a primary credit
quality indicator for the Credit Card and Other Consumer portfolio
segment and the business card portfolio within U.S. small
business commercial. Within the Commercial portfolio segment,
loans are evaluated using the internal classifications of pass rated
or reservable criticized as the primary credit quality indicators. The
term reservable criticized refers to those commercial loans that
are internally classified or listed by the Corporation as Special
Mention, Substandard or Doubtful, which are asset quality
categories defined by regulatory authorities. These assets have
an elevated level of risk and may have a high probability of default
or total loss. Pass rated refers to all loans not considered
reservable criticized. In addition to these primary credit quality
indicators, the Corporation uses other credit quality indicators for
certain types of loans.