Bank of America 2013 Annual Report Download - page 201
Download and view the complete annual report
Please find page 201 of the 2013 Bank of America annual report below. You can navigate through the pages in the report by either clicking on the pages listed below, or by using the keyword search tool below to find specific information within the annual report.-
 1
1 -
2
-
3
-
4
-
5
-
6
-
7
-
8
-
9
-
10
-
11
-
12
-
13
-
14
-
15
-
16
-
17
-
18
-
19
-
20
-
21
-
22
-
23
-
24
-
25
-
26
-
27
-
28
-
29
-
30
-
31
-
32
-
33
-
34
-
35
-
36
-
37
-
38
-
39
-
40
-
41
-
42
-
43
-
44
-
45
-
46
-
47
-
48
-
49
-
50
-
51
-
52
-
53
-
54
-
55
-
56
-
57
-
58
-
59
-
60
-
61
-
62
-
63
-
64
-
65
-
66
-
67
-
68
-
69
-
70
-
71
-
72
-
73
-
74
-
75
-
76
-
77
-
78
-
79
-
80
-
81
-
82
-
83
-
84
-
85
-
86
-
87
-
88
-
89
-
90
-
91
-
92
-
93
-
94
-
95
-
96
-
97
-
98
-
99
-
100
-
101
-
102
-
103
-
104
-
105
-
106
-
107
-
108
-
109
-
110
-
111
-
112
-
113
-
114
-
115
-
116
-
117
-
118
-
119
-
120
-
121
-
122
-
123
-
124
-
125
-
126
-
127
-
128
-
129
-
130
-
131
-
132
-
133
-
134
-
135
-
136
-
137
-
138
-
139
-
140
-
141
-
142
-
143
-
144
-
145
-
146
-
147
-
148
-
149
-
150
-
151
-
152
-
153
-
154
-
155
-
156
-
157
-
158
-
159
-
160
-
161
-
162
-
163
-
164
-
165
-
166
-
167
-
168
-
169
-
170
-
171
-
172
-
173
-
174
-
175
-
176
-
177
-
178
-
179
-
180
-
181
-
182
-
183
-
184
-
185
-
186
-
187
-
188
-
189
-
190
-
 191
191 -
 192
192 -
 193
193 -
 194
194 -
 195
195 -
 196
196 -
 197
197 -
 198
198 -
 199
199 -
 200
200 -
 201
201 -
 202
202 -
 203
203 -
 204
204 -
 205
205 -
 206
206 -
 207
207 -
 208
208 -
 209
209 -
 210
210 -
 211
211 -
212
-
213
-
214
-
215
-
216
-
217
-
218
-
219
-
220
-
221
-
222
-
223
-
224
-
225
-
226
-
227
-
228
-
229
-
230
-
231
-
232
-
233
-
234
-
235
-
236
-
237
-
238
-
239
-
240
-
241
-
242
-
243
-
244
-
245
-
246
-
247
-
248
-
249
-
250
-
251
-
252
-
253
-
254
-
255
-
256
-
257
-
258
-
259
-
260
-
261
-
262
-
263
-
264
-
265
-
266
-
267
-
268
-
269
-
270
-
271
-
272
-
273
-
274
-
275
-
276
-
277
-
278
-
279
-
280
-
281
-
282
-
283
-
284
 |
 |

Bank of America 2013 199
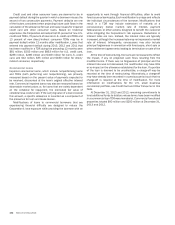
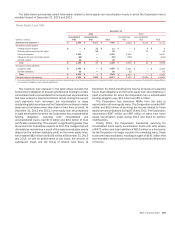
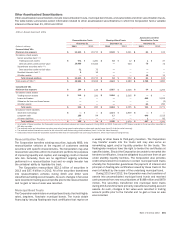
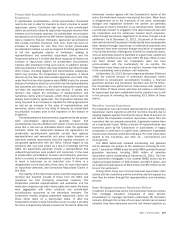
The table below summarizes select information related to home equity loan securitization trusts in which the Corporation held a
variable interest at December 31, 2013 and 2012.
Home Equity Loan VIEs
December 31
2013 2012
(Dollars in millions)
Consolidated
VIEs
Unconsolidated
VIEs Total
Consolidated
VIEs
Unconsolidated
VIEs Total
Maximum loss exposure (1) $ 1,269 $ 6,217 $ 7,486 $ 2,004 $ 6,707 $ 8,711
On-balance sheet assets
Trading account assets $—$12$12
$—$ 8$ 8
Debt securities carried at fair value —2525 —1414
Loans and leases 1,329 — 1,329 2,197 — 2,197
Allowance for loan and lease losses (80) — (80) (193) — (193)
All other assets 20 — 20 ———
Total $ 1,269 $ 37 $ 1,306 $ 2,004 $ 22 $ 2,026
On-balance sheet liabilities
Long-term debt $ 1,450 $ — $ 1,450 $ 2,331 $ — $ 2,331
All other liabilities 90 — 90 92 — 92
Total $ 1,540 $ — $ 1,540 $ 2,423 $ — $ 2,423
Principal balance outstanding $ 1,329 $ 7,542 $ 8,871 $ 2,197 $ 12,644 $ 14,841
(1) For unconsolidated VIEs, the maximum loss exposure includes outstanding trust certificates issued by trusts in rapid amortization, net of recorded reserves, and excludes the liability for representations
and warranties obligations and corporate guarantees.
The maximum loss exposure in the table above includes the
Corporation’s obligation to provide subordinated funding to certain
consolidated and unconsolidated home equity loan securitizations
that have entered a rapid amortization period. During this period,
cash payments from borrowers are accumulated to repay
outstanding debt securities and the Corporation continues to make
advances to borrowers when they draw on their lines of credit. At
December 31, 2013 and 2012, home equity loan securitizations
in rapid amortization for which the Corporation has a subordinated
funding obligation, including both consolidated and
unconsolidated trusts, had $7.6 billion and $9.0 billion of trust
certificates outstanding. This amount is significantly greater than
the amount the Corporation expects to fund. The charges that will
ultimately be recorded as a result of the rapid amortization events
depend on the undrawn available credit on the home equity lines,
which totaled $82 million and $196 million at December 31, 2013
and 2012, as well as performance of the loans, the amount of
subsequent draws and the timing of related cash flows. At
December 31, 2013 and 2012, the reserve for losses on expected
future draw obligations on the home equity loan securitizations in
rapid amortization for which the Corporation has a subordinated
funding obligation was $12 million and $51 million.
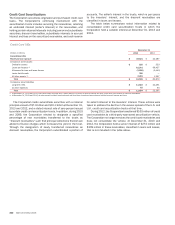
The Corporation has consumer MSRs from the sale or
securitization of home equity loans. The Corporation recorded $47
million and $59 million of servicing fee income related to home
equity loan securitizations during 2013 and 2012. The Corporation
repurchased $287 million and $87 million of loans from home
equity securitization trusts during 2013 and 2012 to perform
modifications.
During 2013, the Corporation transferred servicing for
consolidated home equity securitization trusts with total assets
of $475 million and total liabilities of $616 million to a third party.
As the Corporation no longer services the underlying loans, these
trusts were deconsolidated, resulting in a gain of $141 million that
was recorded in other income (loss) in the Consolidated Statement
of Income.