Bank of America 2013 Annual Report Download - page 46
Download and view the complete annual report
Please find page 46 of the 2013 Bank of America annual report below. You can navigate through the pages in the report by either clicking on the pages listed below, or by using the keyword search tool below to find specific information within the annual report.-
 1
1 -
2
-
3
-
4
-
5
-
6
-
7
-
8
-
9
-
10
-
11
-
12
-
13
-
14
-
15
-
16
-
17
-
18
-
19
-
20
-
21
-
22
-
23
-
24
-
25
-
26
-
27
-
28
-
29
-
30
-
31
-
32
-
33
-
34
-
35
-
 36
36 -
 37
37 -
 38
38 -
 39
39 -
 40
40 -
 41
41 -
 42
42 -
 43
43 -
 44
44 -
 45
45 -
 46
46 -
 47
47 -
 48
48 -
 49
49 -
 50
50 -
 51
51 -
 52
52 -
 53
53 -
 54
54 -
 55
55 -
 56
56 -
57
-
58
-
59
-
60
-
61
-
62
-
63
-
64
-
65
-
66
-
67
-
68
-
69
-
70
-
71
-
72
-
73
-
74
-
75
-
76
-
77
-
78
-
79
-
80
-
81
-
82
-
83
-
84
-
85
-
86
-
87
-
88
-
89
-
90
-
91
-
92
-
93
-
94
-
95
-
96
-
97
-
98
-
99
-
100
-
101
-
102
-
103
-
104
-
105
-
106
-
107
-
108
-
109
-
110
-
111
-
112
-
113
-
114
-
115
-
116
-
117
-
118
-
119
-
120
-
121
-
122
-
123
-
124
-
125
-
126
-
127
-
128
-
129
-
130
-
131
-
132
-
133
-
134
-
135
-
136
-
137
-
138
-
139
-
140
-
141
-
142
-
143
-
144
-
145
-
146
-
147
-
148
-
149
-
150
-
151
-
152
-
153
-
154
-
155
-
156
-
157
-
158
-
159
-
160
-
161
-
162
-
163
-
164
-
165
-
166
-
167
-
168
-
169
-
170
-
171
-
172
-
173
-
174
-
175
-
176
-
177
-
178
-
179
-
180
-
181
-
182
-
183
-
184
-
185
-
186
-
187
-
188
-
189
-
190
-
191
-
192
-
193
-
194
-
195
-
196
-
197
-
198
-
199
-
200
-
201
-
202
-
203
-
204
-
205
-
206
-
207
-
208
-
209
-
210
-
211
-
212
-
213
-
214
-
215
-
216
-
217
-
218
-
219
-
220
-
221
-
222
-
223
-
224
-
225
-
226
-
227
-
228
-
229
-
230
-
231
-
232
-
233
-
234
-
235
-
236
-
237
-
238
-
239
-
240
-
241
-
242
-
243
-
244
-
245
-
246
-
247
-
248
-
249
-
250
-
251
-
252
-
253
-
254
-
255
-
256
-
257
-
258
-
259
-
260
-
261
-
262
-
263
-
264
-
265
-
266
-
267
-
268
-
269
-
270
-
271
-
272
-
273
-
274
-
275
-
276
-
277
-
278
-
279
-
280
-
281
-
282
-
283
-
284
 |
 |

44 Bank of America 2013
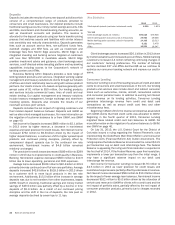
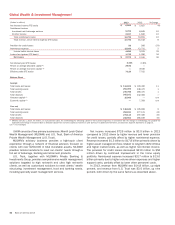
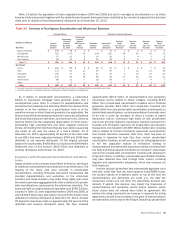
Global Markets
(Dollars in millions) 2013 2012 % Change
Net interest income (FTE basis) $ 4,239 $ 3,672 15%
Noninterest income:
Investment and brokerage services 2,046 1,820 12
Investment banking fees 2,722 2,214 23
Trading account profits 6,734 5,706 18
All other income 317 872 (64)
Total noninterest income 11,819 10,612 11
Total revenue, net of interest expense (FTE basis) 16,058 14,284 12
Provision for credit losses 140 34 n/m
Noninterest expense 12,013 11,295 6
Income before income taxes 3,905 2,955 32
Income tax expense (FTE basis) 2,342 1,726 36
Net income $ 1,563 $ 1,229 27
Return on average allocated capital (1) 5.24%—
Return on average economic capital (1) —8.95%
Efficiency ratio (FTE basis) 74.81 79.08
Balance Sheet
Average
Total trading-related assets (2) $ 468,934 $ 466,045 1
Total earning assets (2) 481,482 461,487 4
Total assets 632,804 606,249 4
Allocated capital (1) 30,000 — n/m
Economic capital (1) —13,824 n/m
Year end
Total trading-related assets (2) $ 411,080 $ 465,836 (12)
Total earning assets (2) 432,821 486,470 (11)
Total assets 575,709 632,263 (9)
(1) Effective January 1, 2013, we revised, on a prospective basis, the methodology for allocating capital to the business segments. In connection with the change in methodology, we updated the
applicable terminology in the above table to allocated capital from economic capital as reported in prior periods. For additional information, see Business Segment Operations on page 31.
(2) Trading-related assets include derivative assets, which are considered non-earning assets.
n/m = not meaningful
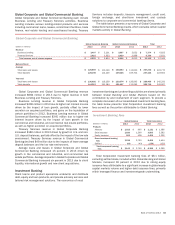
Global Markets offers sales and trading services, including
research, to institutional clients across fixed-income, credit,
currency, commodity and equity businesses. Global Markets
product coverage includes securities and derivative products in
both the primary and secondary markets. Global Markets provides
market-making, financing, securities clearing, settlement and
custody services globally to our institutional investor clients in
support of their investing and trading activities. We also work with
our commercial and corporate clients to provide risk management
products using interest rate, equity, credit, currency and commodity
derivatives, foreign exchange, fixed-income and mortgage-related
products. As a result of our market-making activities in these
products, we may be required to manage risk in a broad range of
financial products including government securities, equity and
equity-linked securities, high-grade and high-yield corporate debt
securities, syndicated loans, MBS, commodities and asset-backed
securities (ABS). In addition, the economics of most investment
banking and underwriting activities are shared primarily between
Global Markets and Global Banking based on the activities
performed by each segment. Global Banking originates certain
deal-related transactions with our corporate and commercial
clients that are executed and distributed by Global Markets. For
more information on investment banking fees on a consolidated
basis, see page 43.
Net income for Global Markets increased $334 million to $1.6
billion in 2013 compared to 2012. Excluding net DVA and charges
related to the U.K. corporate income tax rate reduction, net income
decreased $543 million to $3.0 billion primarily driven by lower
FICC revenue due to a challenging trading environment and higher
noninterest expense, partially offset by an increase in equities
revenue. Net DVA losses on derivatives were $508 million
compared to losses of $2.4 billion in 2012. The U.K. corporate
income tax rate reduction enacted in 2013 resulted in a $1.1
billion charge to income tax expense in Global Markets for
remeasurement of certain deferred tax assets compared to a
similar charge of $781 million in 2012. Noninterest expense
increased $718 million to $12.0 billion due to an increase in
litigation expense.
Average earning assets increased $20.0 billion to $481.5
billion in 2013 largely driven by increased client financing activity
in the equities business.
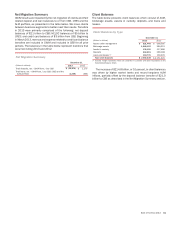
Sales and Trading Revenue
Sales and trading revenue includes unrealized and realized gains
and losses on trading and other assets, net interest income, and
fees primarily from commissions on equity securities. Sales and
trading revenue is segregated into fixed income (government debt
obligations, investment and non-investment grade corporate debt