Bank of America 2013 Annual Report Download - page 204
Download and view the complete annual report
Please find page 204 of the 2013 Bank of America annual report below. You can navigate through the pages in the report by either clicking on the pages listed below, or by using the keyword search tool below to find specific information within the annual report.-
 1
1 -
2
-
3
-
4
-
5
-
6
-
7
-
8
-
9
-
10
-
11
-
12
-
13
-
14
-
15
-
16
-
17
-
18
-
19
-
20
-
21
-
22
-
23
-
24
-
25
-
26
-
27
-
28
-
29
-
30
-
31
-
32
-
33
-
34
-
35
-
36
-
37
-
38
-
39
-
40
-
41
-
42
-
43
-
44
-
45
-
46
-
47
-
48
-
49
-
50
-
51
-
52
-
53
-
54
-
55
-
56
-
57
-
58
-
59
-
60
-
61
-
62
-
63
-
64
-
65
-
66
-
67
-
68
-
69
-
70
-
71
-
72
-
73
-
74
-
75
-
76
-
77
-
78
-
79
-
80
-
81
-
82
-
83
-
84
-
85
-
86
-
87
-
88
-
89
-
90
-
91
-
92
-
93
-
94
-
95
-
96
-
97
-
98
-
99
-
100
-
101
-
102
-
103
-
104
-
105
-
106
-
107
-
108
-
109
-
110
-
111
-
112
-
113
-
114
-
115
-
116
-
117
-
118
-
119
-
120
-
121
-
122
-
123
-
124
-
125
-
126
-
127
-
128
-
129
-
130
-
131
-
132
-
133
-
134
-
135
-
136
-
137
-
138
-
139
-
140
-
141
-
142
-
143
-
144
-
145
-
146
-
147
-
148
-
149
-
150
-
151
-
152
-
153
-
154
-
155
-
156
-
157
-
158
-
159
-
160
-
161
-
162
-
163
-
164
-
165
-
166
-
167
-
168
-
169
-
170
-
171
-
172
-
173
-
174
-
175
-
176
-
177
-
178
-
179
-
180
-
181
-
182
-
183
-
184
-
185
-
186
-
187
-
188
-
189
-
190
-
191
-
192
-
193
-
 194
194 -
 195
195 -
 196
196 -
 197
197 -
 198
198 -
 199
199 -
 200
200 -
 201
201 -
 202
202 -
 203
203 -
 204
204 -
 205
205 -
 206
206 -
 207
207 -
 208
208 -
 209
209 -
 210
210 -
 211
211 -
 212
212 -
 213
213 -
 214
214 -
215
-
216
-
217
-
218
-
219
-
220
-
221
-
222
-
223
-
224
-
225
-
226
-
227
-
228
-
229
-
230
-
231
-
232
-
233
-
234
-
235
-
236
-
237
-
238
-
239
-
240
-
241
-
242
-
243
-
244
-
245
-
246
-
247
-
248
-
249
-
250
-
251
-
252
-
253
-
254
-
255
-
256
-
257
-
258
-
259
-
260
-
261
-
262
-
263
-
264
-
265
-
266
-
267
-
268
-
269
-
270
-
271
-
272
-
273
-
274
-
275
-
276
-
277
-
278
-
279
-
280
-
281
-
282
-
283
-
284
 |
 |

202 Bank of America 2013
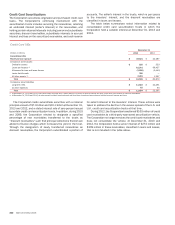
The Corporation’s liquidity commitments to unconsolidated
municipal bond trusts, including those for which the Corporation
was transferor, totaled $2.1 billion and $2.8 billion at
December 31, 2013 and 2012. The weighted-average remaining
life of bonds held in the trusts at December 31, 2013 was 8.2
years. There were no material write-downs or downgrades of assets
or issuers during 2013 and 2012.
Automobile and Other Securitization Trusts
The Corporation transfers automobile and other loans into
securitization trusts, typically to improve liquidity or manage credit
risk. During 2012, the Corporation transferred automobile loans
into an unconsolidated automobile trust, receiving cash proceeds
of $2.4 billion and recording a loss on sale of $7 million. At
December 31, 2013 and 2012, the Corporation serviced assets
or otherwise had continuing involvement with automobile and other
securitization trusts with outstanding balances of $2.5 billion and
$4.7 billion, including trusts collateralized by automobile loans of
$877 million and $3.5 billion, student loans of $741 million and
$897 million, and other loans of $911 million and $290 million.
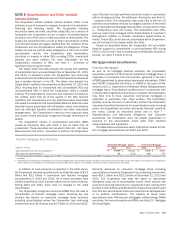
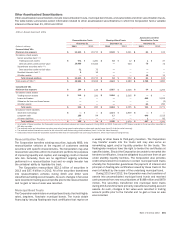
Other Variable Interest Entities
The table below summarizes select information related to other
VIEs in which the Corporation held a variable interest at
December 31, 2013 and 2012.
Other VIEs
December 31
2013 2012
(Dollars in millions) Consolidated Unconsolidated Total Consolidated Unconsolidated Total
Maximum loss exposure $ 9,716 $ 12,523 $ 22,239 $ 10,803 $ 9,269 $ 20,072
On-balance sheet assets
Trading account assets $ 3,769 $ 1,420 $ 5,189 $ 5,181 $ 356 $ 5,537
Derivative assets 3 739 742 10 1,277 1,287
Debt securities carried at fair value — 1,944 1,944 —3939
Loans and leases 4,609 270 4,879 5,084 67 5,151
Allowance for loan and lease losses (6) — (6) (14) — (14)
Loans held-for-sale 998 85 1,083 1,055 157 1,212
All other assets 1,734 6,167 7,901 1,764 5,844 7,608
Total $ 11,107 $ 10,625 $ 21,732 $ 13,080 $ 7,740 $ 20,820
On-balance sheet liabilities
Short-term borrowings $77$ —$77
$ 131 $ — $ 131
Long-term debt (1) 4,487 — 4,487 6,874 — 6,874
All other liabilities 93 2,538 2,631 92 2,092 2,184
Total $ 4,657 $ 2,538 $ 7,195 $ 7,097 $ 2,092 $ 9,189
Total assets of VIEs $ 11,107 $ 38,505 $ 49,612 $ 13,080 $ 39,700 $ 52,780
(1) Includes $1.3 billion, $1.2 billion and $780 million of long-term debt at December 31, 2013 and $2.8 billion, $1.2 billion and $780 million of long-term debt at December 31, 2012 issued by
consolidated CDO vehicles, customer vehicles and investment vehicles, respectively, which has recourse to the general credit of the Corporation.
Customer Vehicles
Customer vehicles include credit-linked, equity-linked and
commodity-linked note vehicles, repackaging vehicles, and asset
acquisition vehicles, which are typically created on behalf of
customers who wish to obtain market or credit exposure to a
specific company, index, commodity price or financial instrument.
The Corporation may transfer assets to and invest in securities
issued by these vehicles. The Corporation typically enters into
credit, equity, interest rate, commodity or foreign currency
derivatives to synthetically create or alter the investment profile
of the issued securities.
The Corporation’s maximum loss exposure to consolidated and
unconsolidated customer vehicles totaled $5.9 billion and $4.4
billion at December 31, 2013 and 2012, including the notional
amount of derivatives to which the Corporation is a counterparty,
net of losses previously recorded, and the Corporation’s
investment, if any, in securities issued by the vehicles. The
maximum loss exposure has not been reduced to reflect the benefit
of offsetting swaps with the customers or collateral arrangements.
The Corporation also had liquidity commitments, including written
put options and collateral value guarantees, with certain
unconsolidated vehicles of $748 million and $742 million at
December 31, 2013 and 2012, that are included in the table
above.
Collateralized Debt Obligation Vehicles
The Corporation receives fees for structuring CDO vehicles, which
hold diversified pools of fixed-income securities, typically corporate
debt or ABS, which they fund by issuing multiple tranches of debt
and equity securities. Synthetic CDOs enter into a portfolio of CDS
to synthetically create exposure to fixed-income securities. CLOs,
which are a subset of CDOs, hold pools of loans, typically corporate
loans or commercial mortgages. CDOs are typically managed by
third-party portfolio managers. The Corporation typically transfers
assets to these CDOs, holds securities issued by the CDOs and
may be a derivative counterparty to the CDOs, including a CDS
counterparty for synthetic CDOs. The Corporation has also entered
into total return swaps with certain CDOs whereby the Corporation
absorbs the economic returns generated by specified assets held
by the CDO.