Bank of America 2013 Annual Report Download - page 90
Download and view the complete annual report
Please find page 90 of the 2013 Bank of America annual report below. You can navigate through the pages in the report by either clicking on the pages listed below, or by using the keyword search tool below to find specific information within the annual report.-
 1
1 -
2
-
3
-
4
-
5
-
6
-
7
-
8
-
9
-
10
-
11
-
12
-
13
-
14
-
15
-
16
-
17
-
18
-
19
-
20
-
21
-
22
-
23
-
24
-
25
-
26
-
27
-
28
-
29
-
30
-
31
-
32
-
33
-
34
-
35
-
36
-
37
-
38
-
39
-
40
-
41
-
42
-
43
-
44
-
45
-
46
-
47
-
48
-
49
-
50
-
51
-
52
-
53
-
54
-
55
-
56
-
57
-
58
-
59
-
60
-
61
-
62
-
63
-
64
-
65
-
66
-
67
-
68
-
69
-
70
-
71
-
72
-
73
-
74
-
75
-
76
-
77
-
78
-
79
-
 80
80 -
 81
81 -
 82
82 -
 83
83 -
 84
84 -
 85
85 -
 86
86 -
 87
87 -
 88
88 -
 89
89 -
 90
90 -
 91
91 -
 92
92 -
 93
93 -
 94
94 -
 95
95 -
 96
96 -
 97
97 -
 98
98 -
 99
99 -
 100
100 -
101
-
102
-
103
-
104
-
105
-
106
-
107
-
108
-
109
-
110
-
111
-
112
-
113
-
114
-
115
-
116
-
117
-
118
-
119
-
120
-
121
-
122
-
123
-
124
-
125
-
126
-
127
-
128
-
129
-
130
-
131
-
132
-
133
-
134
-
135
-
136
-
137
-
138
-
139
-
140
-
141
-
142
-
143
-
144
-
145
-
146
-
147
-
148
-
149
-
150
-
151
-
152
-
153
-
154
-
155
-
156
-
157
-
158
-
159
-
160
-
161
-
162
-
163
-
164
-
165
-
166
-
167
-
168
-
169
-
170
-
171
-
172
-
173
-
174
-
175
-
176
-
177
-
178
-
179
-
180
-
181
-
182
-
183
-
184
-
185
-
186
-
187
-
188
-
189
-
190
-
191
-
192
-
193
-
194
-
195
-
196
-
197
-
198
-
199
-
200
-
201
-
202
-
203
-
204
-
205
-
206
-
207
-
208
-
209
-
210
-
211
-
212
-
213
-
214
-
215
-
216
-
217
-
218
-
219
-
220
-
221
-
222
-
223
-
224
-
225
-
226
-
227
-
228
-
229
-
230
-
231
-
232
-
233
-
234
-
235
-
236
-
237
-
238
-
239
-
240
-
241
-
242
-
243
-
244
-
245
-
246
-
247
-
248
-
249
-
250
-
251
-
252
-
253
-
254
-
255
-
256
-
257
-
258
-
259
-
260
-
261
-
262
-
263
-
264
-
265
-
266
-
267
-
268
-
269
-
270
-
271
-
272
-
273
-
274
-
275
-
276
-
277
-
278
-
279
-
280
-
281
-
282
-
283
-
284
 |
 |

88 Bank of America 2013
do not meet the requirements for treatment as accounting hedges.
They are carried at fair value with changes in fair value recorded
in other income (loss).
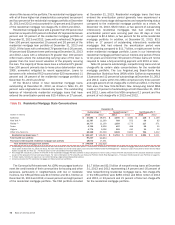
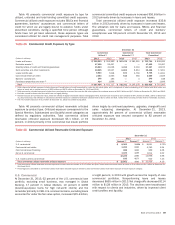
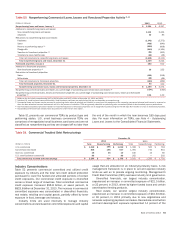
Commercial Credit Portfolio
During 2013, credit quality in the commercial loan portfolio
continued to show improvement. Reservable criticized balances
and nonperforming loans, leases and foreclosed property
balances declined during 2013 with the declines primarily in the
U.S. commercial and commercial real estate portfolios. Most other
credit quality indicators across the remaining commercial
portfolios also improved. The allowance for loan and lease losses
for the commercial portfolio increased $899 million in 2013 to
$4.0 billion as continued improvement in credit quality was more
than offset by an increase associated with loan growth across the
core commercial portfolio (total commercial products excluding
U.S. small business). For additional information, see Allowance
for Credit Losses on page 100.
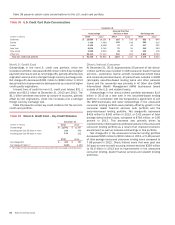
Table 43 presents our commercial loans and leases, and
related credit quality information at December 31, 2013 and
2012.
Table 43 Commercial Loans and Leases
December 31
Outstandings Nonperforming
Accruing Past Due
90 Days or More
(Dollars in millions) 2013 2012 2013 2012 2013 2012
U.S. commercial $ 212,557 $197,126 $819 $ 1,484 $47 $65
Commercial real estate (1) 47,893 38,637 322 1,513 21 29
Commercial lease financing 25,199 23,843 16 44 41 15
Non-U.S. commercial 89,462 74,184 64 68 17 —
375,111 333,790 1,221 3,109 126 109
U.S. small business commercial (2) 13,294 12,593 88 115 78 120
Commercial loans excluding loans accounted for under the fair value option 388,405 346,383 1,309 3,224 204 229
Loans accounted for under the fair value option (3) 7,878 7,997 211 ——
Total commercial loans and leases $ 396,283 $354,380 $ 1,311 $ 3,235 $204 $ 229
(1) Includes U.S. commercial real estate loans of $46.3 billion and $37.2 billion and non-U.S. commercial real estate loans of $1.6 billion and $1.5 billion at December 31, 2013 and 2012.
(2) Includes card-related products.
(3) Commercial loans accounted for under the fair value option include U.S. commercial loans of $1.5 billion and $2.3 billion and non-U.S. commercial loans of $6.4 billion and $5.7 billion at December
31, 2013 and 2012. For more information on the fair value option, see Note 21 – Fair Value Option to the Consolidated Financial Statements.
Outstanding commercial loans and leases increased $41.9
billion in 2013, primarily in U.S. commercial and non-U.S.
commercial product types. Nonperforming commercial loans and
leases as a percentage of outstanding commercial loans and
leases improved during 2013 to 0.33 percent from 0.91 percent
(0.34 percent and 0.93 percent excluding loans accounted for
under the fair value option) at December 31, 2012.
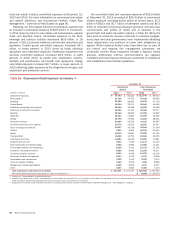
Table 44 presents net charge-offs and related ratios for our
commercial loans and leases for 2013 and 2012. Improving trends
across the portfolio drove lower charge-offs.
Table 44 Commercial Net Charge-offs and Related Ratios
Net Charge-offs Net Charge-off Ratios (1)
(Dollars in millions) 2013 2012 2013 2012
U.S. commercial $128 $ 242 0.06%0.13%
Commercial real estate 149 384 0.35 1.01
Commercial lease financing (25) (6)(0.10) (0.03)
Non-U.S. commercial 45 28 0.05 0.05
297 648 0.08 0.21
U.S. small business commercial 359 699 2.84 5.46
Total commercial $ 656 $ 1,347 0.18 0.43
(1) Net charge-off ratios are calculated as net charge-offs divided by average outstanding loans and leases excluding loans accounted for under the fair value option.