Bank of America 2013 Annual Report Download - page 178
Download and view the complete annual report
Please find page 178 of the 2013 Bank of America annual report below. You can navigate through the pages in the report by either clicking on the pages listed below, or by using the keyword search tool below to find specific information within the annual report.-
 1
1 -
2
-
3
-
4
-
5
-
6
-
7
-
8
-
9
-
10
-
11
-
12
-
13
-
14
-
15
-
16
-
17
-
18
-
19
-
20
-
21
-
22
-
23
-
24
-
25
-
26
-
27
-
28
-
29
-
30
-
31
-
32
-
33
-
34
-
35
-
36
-
37
-
38
-
39
-
40
-
41
-
42
-
43
-
44
-
45
-
46
-
47
-
48
-
49
-
50
-
51
-
52
-
53
-
54
-
55
-
56
-
57
-
58
-
59
-
60
-
61
-
62
-
63
-
64
-
65
-
66
-
67
-
68
-
69
-
70
-
71
-
72
-
73
-
74
-
75
-
76
-
77
-
78
-
79
-
80
-
81
-
82
-
83
-
84
-
85
-
86
-
87
-
88
-
89
-
90
-
91
-
92
-
93
-
94
-
95
-
96
-
97
-
98
-
99
-
100
-
101
-
102
-
103
-
104
-
105
-
106
-
107
-
108
-
109
-
110
-
111
-
112
-
113
-
114
-
115
-
116
-
117
-
118
-
119
-
120
-
121
-
122
-
123
-
124
-
125
-
126
-
127
-
128
-
129
-
130
-
131
-
132
-
133
-
134
-
135
-
136
-
137
-
138
-
139
-
140
-
141
-
142
-
143
-
144
-
145
-
146
-
147
-
148
-
149
-
150
-
151
-
152
-
153
-
154
-
155
-
156
-
157
-
158
-
159
-
160
-
161
-
162
-
163
-
164
-
165
-
166
-
167
-
 168
168 -
 169
169 -
 170
170 -
 171
171 -
 172
172 -
 173
173 -
 174
174 -
 175
175 -
 176
176 -
 177
177 -
 178
178 -
 179
179 -
 180
180 -
 181
181 -
 182
182 -
 183
183 -
 184
184 -
 185
185 -
 186
186 -
 187
187 -
 188
188 -
189
-
190
-
191
-
192
-
193
-
194
-
195
-
196
-
197
-
198
-
199
-
200
-
201
-
202
-
203
-
204
-
205
-
206
-
207
-
208
-
209
-
210
-
211
-
212
-
213
-
214
-
215
-
216
-
217
-
218
-
219
-
220
-
221
-
222
-
223
-
224
-
225
-
226
-
227
-
228
-
229
-
230
-
231
-
232
-
233
-
234
-
235
-
236
-
237
-
238
-
239
-
240
-
241
-
242
-
243
-
244
-
245
-
246
-
247
-
248
-
249
-
250
-
251
-
252
-
253
-
254
-
255
-
256
-
257
-
258
-
259
-
260
-
261
-
262
-
263
-
264
-
265
-
266
-
267
-
268
-
269
-
270
-
271
-
272
-
273
-
274
-
275
-
276
-
277
-
278
-
279
-
280
-
281
-
282
-
283
-
284
 |
 |

176 Bank of America 2013
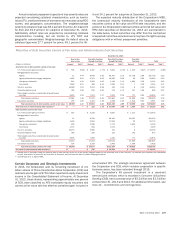
At December 31, 2013, the accumulated net unrealized loss
on AFS debt securities included in accumulated OCI was $3.3
billion, net of the related income tax benefit of $1.9 billion. At
December 31, 2013 and 2012, the Corporation had
nonperforming AFS debt securities of $103 million and $91 million.
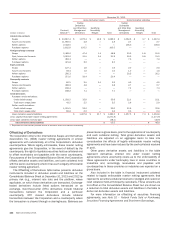
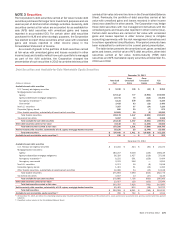
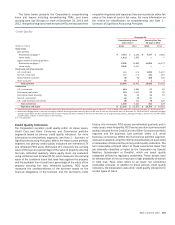
The following table presents the components of other debt
securities carried at fair value where the changes in fair value are
reported in other income (loss) at December 31, 2013 and 2012.
In 2013, the Corporation recorded unrealized mark-to-market net
losses in other income (loss) of $1.3 billion and realized losses
of $1.0 billion on other debt securities carried at fair value, which
excludes the benefit of certain hedges the results of which are
also reported in other income (loss). Amounts in 2012 were
insignificant.
Other Debt Securities Carried at Fair Value
December 31
(Dollars in millions) 2013 2012
U.S. Treasury and agency securities $ 4,062 $ 491
Mortgage-backed securities:
Agency 16,500 13,073
Agency-collateralized mortgage obligations 218 929
Commercial 749 —
Non-U.S. securities (1) 11,315 9,451
Total $ 32,844 $ 23,944
(1) These securities are primarily used to satisfy certain international regulatory liquidity
requirements.
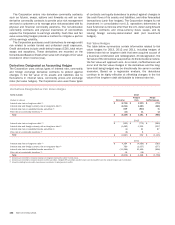
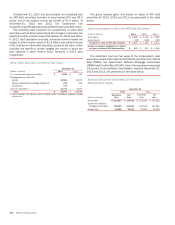
The gross realized gains and losses on sales of AFS debt
securities for 2013, 2012 and 2011 are presented in the table
below.
Gains and Losses on Sales of AFS Debt Securities
(Dollars in millions) 2013 2012 2011
Gross gains $ 1,302 $ 2,128 $ 3,685
Gross losses (31) (466) (311)
Net gains on sales of AFS debt securities $ 1,271 $ 1,662 $ 3,374
Income tax expense attributable to realized
net gains on sales of AFS debt securities $ 470 $ 615 $ 1,248
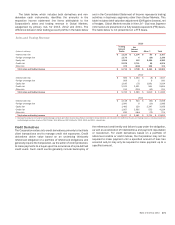
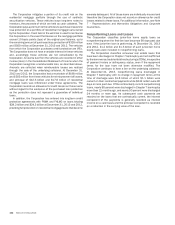
The amortized cost and fair value of the Corporation’s debt
securities carried at fair value and HTM debt securities from Fannie
Mae (FNMA), the Government National Mortgage Association
(GNMA) and Freddie Mac (FHLMC), where the investment exceeded
10 percent of consolidated shareholders’ equity at December 31,
2013 and 2012, are presented in the table below.
Selected Securities Exceeding 10 Percent of
Shareholders’ Equity
December 31
2013 2012
(Dollars in millions)
Amortized
Cost
Fair
Value
Amortized
Cost
Fair
Value
Fannie Mae $ 123,813 $ 118,708 $ 121,522 $ 123,933
Government National
Mortgage Association 118,700 115,314 124,348 127,541
Freddie Mac 24,908 24,075 22,995 23,502