Bank of America 2013 Annual Report Download - page 264
Download and view the complete annual report
Please find page 264 of the 2013 Bank of America annual report below. You can navigate through the pages in the report by either clicking on the pages listed below, or by using the keyword search tool below to find specific information within the annual report.-
 1
1 -
2
-
3
-
4
-
5
-
6
-
7
-
8
-
9
-
10
-
11
-
12
-
13
-
14
-
15
-
16
-
17
-
18
-
19
-
20
-
21
-
22
-
23
-
24
-
25
-
26
-
27
-
28
-
29
-
30
-
31
-
32
-
33
-
34
-
35
-
36
-
37
-
38
-
39
-
40
-
41
-
42
-
43
-
44
-
45
-
46
-
47
-
48
-
49
-
50
-
51
-
52
-
53
-
54
-
55
-
56
-
57
-
58
-
59
-
60
-
61
-
62
-
63
-
64
-
65
-
66
-
67
-
68
-
69
-
70
-
71
-
72
-
73
-
74
-
75
-
76
-
77
-
78
-
79
-
80
-
81
-
82
-
83
-
84
-
85
-
86
-
87
-
88
-
89
-
90
-
91
-
92
-
93
-
94
-
95
-
96
-
97
-
98
-
99
-
100
-
101
-
102
-
103
-
104
-
105
-
106
-
107
-
108
-
109
-
110
-
111
-
112
-
113
-
114
-
115
-
116
-
117
-
118
-
119
-
120
-
121
-
122
-
123
-
124
-
125
-
126
-
127
-
128
-
129
-
130
-
131
-
132
-
133
-
134
-
135
-
136
-
137
-
138
-
139
-
140
-
141
-
142
-
143
-
144
-
145
-
146
-
147
-
148
-
149
-
150
-
151
-
152
-
153
-
154
-
155
-
156
-
157
-
158
-
159
-
160
-
161
-
162
-
163
-
164
-
165
-
166
-
167
-
168
-
169
-
170
-
171
-
172
-
173
-
174
-
175
-
176
-
177
-
178
-
179
-
180
-
181
-
182
-
183
-
184
-
185
-
186
-
187
-
188
-
189
-
190
-
191
-
192
-
193
-
194
-
195
-
196
-
197
-
198
-
199
-
200
-
201
-
202
-
203
-
204
-
205
-
206
-
207
-
208
-
209
-
210
-
211
-
212
-
213
-
214
-
215
-
216
-
217
-
218
-
219
-
220
-
221
-
222
-
223
-
224
-
225
-
226
-
227
-
228
-
229
-
230
-
231
-
232
-
233
-
234
-
235
-
236
-
237
-
238
-
239
-
240
-
241
-
242
-
243
-
244
-
245
-
246
-
247
-
248
-
249
-
250
-
251
-
252
-
253
-
 254
254 -
 255
255 -
 256
256 -
 257
257 -
 258
258 -
 259
259 -
 260
260 -
 261
261 -
 262
262 -
 263
263 -
 264
264 -
 265
265 -
 266
266 -
 267
267 -
 268
268 -
 269
269 -
 270
270 -
 271
271 -
 272
272 -
 273
273 -
 274
274 -
275
-
276
-
277
-
278
-
279
-
280
-
281
-
282
-
283
-
284
 |
 |

262 Bank of America 2013
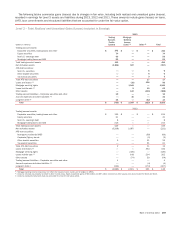
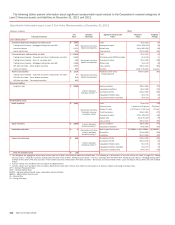
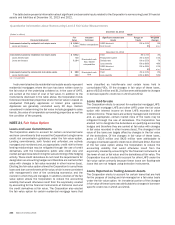
The following tables present information about significant unobservable inputs related to the Corporation’s material categories of
Level 3 financial assets and liabilities at December 31, 2013 and 2012.
Quantitative Information about Level 3 Fair Value Measurements at December 31, 2013
(Dollars in millions) Inputs
Financial Instrument
Fair
Value
Valuation
Technique
Significant Unobservable
Inputs
Ranges of
Inputs
Weighted
Average
Loans and Securities (1)
Instruments backed by residential real estate assets $ 3,443
Discounted cash flow,
Market comparables
Yield 2% to 25% 6%
Trading account assets – Mortgage trading loans and ABS 363 Prepayment speed 0% to 35% CPR 9%
Loans and leases 2,151 Default rate 1% to 20% CDR 6%
Loans held-for-sale 929 Loss severity 21% to 80% 35%
Commercial loans, debt securities and other $ 12,135
Discounted cash flow,
Market comparables
Yield 0% to 45% 5%
Trading account assets – Corporate securities, trading loans and other 3,462 Enterprise value/EBITDA multiple 0x to 24x 7x
Trading account assets – Non-U.S. sovereign debt 468 Prepayment speed 5% to 40% 19%
Trading account assets – Mortgage trading loans and ABS 4,268 Default rate 1% to 5% 4%
AFS debt securities – Other taxable securities 3,031 Loss severity 25% to 42% 36%
Loans and leases 906 Duration 1 year to 5 years 4 years
Auction rate securities $ 1,719
Discounted cash flow,
Market comparables
Projected tender price/
Refinancing level
60% to 100% 96%
Trading account assets – Corporate securities, trading loans and other 97
AFS debt securities – Other taxable securities 816
AFS debt securities – Tax-exempt securities 806
Structured liabilities
Long-term debt $ (1,990)
Industry standard
derivative pricing (2, 3)
Equity correlation 18% to 98% 70%
Long-dated volatilities 4% to 63% 27%
Correlation (IR/IR) 24% to 99% 60%
Long-dated inflation rates 0% to 3% 2%
Long-dated inflation volatilities 0% to 2% 1%
Net derivatives assets
Credit derivatives $ 1,008
Discounted cash flow,
Stochastic recovery
correlation model
Yield 3% to 25% 14%
Upfront points 0 points to 100 points 63 points
Spread to index -1,407 bps to 1,741 bps 91 bps
Credit correlation 14% to 99% 47%
Prepayment speed 3% to 40% CPR 13%
Default rate 1% to 5% CDR 3%
Loss severity 20% to 42% 35%
Equity derivatives $ (1,596) Industry standard
derivative pricing (2)
Equity correlation 18% to 98% 70%
Long-dated volatilities 4% to 63% 27%
Commodity derivatives $ 6 Discounted cash flow,
Industry standard
derivative pricing (2)
Natural gas forward price $3/MMBtu to $11/MMBtu $6/MMBtu
Correlation 47% to 89% 81%
Volatilities 9% to 109% 30%
Interest rate derivatives $ 558
Industry standard
derivative pricing (3)
Correlation (IR/IR) 24% to 99% 60%
Correlation (FX/IR) -30% to 40% -4%
Long-dated inflation rates 0% to 3% 2%
Long-dated inflation volatilities 0% to 2% 1%
Long-dated volatilities (FX) 0% to 70% 10%
Total net derivative assets $ (24)
(1) The categories are aggregated based upon product type which differs from financial statement classification. The following is a reconciliation to the line items in the table on page 254: Trading
account assets – Corporate securities, trading loans and other of $3.6 billion, Trading account assets – Non-U.S. sovereign debt of $468 million, Trading account assets – Mortgage trading loans
and ABS of $4.6 billion, AFS debt securities – Other taxable securities of $3.8 billion, AFS debt securities – Tax-exempt securities of $806 million, Loans and leases of $3.1 billion and LHFS of $929
million.
(2) Includes models such as Monte Carlo simulation and Black-Scholes.
(3) Includes models such as Monte Carlo simulation, Black-Scholes and other methods that model the joint dynamics of interest, inflation and foreign exchange rates.
CPR = Constant Prepayment Rate
CDR = Constant Default Rate
EBITDA = Earnings before interest, taxes, depreciation and amortization
MMBtu = Million British thermal units
IR = Interest Rate
FX = Foreign Exchange